Hyperledger Fabric Deployment Using Helm Chart

Henry Zhang, Jiahao Chen, Hui Hu, Wenkai Yin

This blog post is to share the personal technical experience of the authors. It does not represent in any way the opinions of the authors’ employers.

* We assume readers are familiar with Helm, Docker, Kubernetes, and have knowledge of the Fabric’s architecture.

This post introduces an approach to deploy Fabric via Helm Chart. The Chart allows a user to flexibly configure the consensus algorithm (solo/Kafka) and the number of organizations and nodes of the Fabric network.

Our previous blogs describe how to deploy Fabric on Kubernetes (K8s), which were widely read and followed by the community members. Many readers were inspired by our posts e and were able to use the K8s to manage their Fabric cluster. If you are new to this domain, you can review our previous posts and understand the steps that are used in deploying Fabric on Kubernetes.

Helm Chart is used as a preferred way by more and more developers to deploy their applications on Kubernetes. It is growing as to be a de facto standard. The advantage of Helm is its highly automated and repeatable deployment. A single “Helm” command can perform a series of actions, while it takes a number of “kubectl” commands to achieve the same purpose.

Introduction of Helm

Helm is a package manager for Kubernetes. It simplifies the deployment and management of Kubernetes applications. Helm has three important concepts:

  • Chart: defines a package format that can be deployed on Kubernetes. A Chart contains a set of files that describe Kubernetes related resources.
  • Config: used to store the configuration information of the software, used together with Chart to create a Release.
  • Release: a running instance of a Chart.

Helm consists of two important functional components: the Helm Client and the Tiller Server.

  • Helm Client is a command-line tool for end users. It is used primarily for developing local charts, managing Chart repositories, and interacting with Tiller Server.
  • Tiller Server is installed in the Kubernetes cluster. It accepts requests from the Helm Client and interacts with the Kubernetes API Server, including responding to Helm Client requests, combining Chart and Config to create Releases, installing Charts into Kubernetes and keeping track of status.

Deploying Fabric by Helm Chart

  1. Helm installation

Please refer to the official document: https://docs.helm.sh/using_helm/#installing-helm

  1. Preparing the NFS server

In our deployment model, an NFS server is a place for sharing the configuration information among the Fabric nodes, so an available NFS server is required. For the details of how NFS server works in deployment, please refer to this post: How to Deploy Hyperledger Fabric on Kubernetes (1)

  1. Generating Certificates

In Fabric’ github repo (https://github.com/hyperledger/fabric), you could find a tool called “cryptogen”, which allows user to generate certificate files. The certificates are used by entities of Fabric network such as users and nodes.

In general, a user can define the organization structure in a YAML file, such as the number of organizations, the name and domain of organizations. The “cryptogen” tool can load the configuration file and generate corresponding certificate files.

A sample configuration file called “cluster-config.yaml” is as follows:

OrdererOrgs:

- Name: Orderer

Domain: example.com

Template:

Count: 1

PeerOrgs:

- Name: Org1

Domain: org1.example.com

Template:

Count: 1

- Name: Org2

Domain: org2.example.com

Template:

Count: 1

The keywords of OrdererOrgs and PeerOrgs are used to distinguish the types of organizations. The structure of the two organizations is as follows:

  • OrdererOrgs defines the information of the orderer organization. The above sample defines an organization named “Orderer” whose domain name is “example.com”, and it specifies the value of “Template.Count” as 1, thus there is only one orderer certificate will be generated, which is identified by “orderer0”.
  • PeerOrgs defines the information of the peer organization. The above sample defines two organizations: “Org1” and “Org2” . The corresponding domain names are “org1.example.com” and “org2.example.com”. Like the orderer, a Peer is provisioned to each organization. The first peer in “Org1” and “Org2” are both identified as “peer0”. They can be easily distinguished by the domain name.

For more configuration information about cryptogen, please refer to the description in the source code.

  1. Downloading the Chart

Download the chart via git clone:

https://github.com/LordGoodman/fabric-chart

or

https://github.com/hainingzhang/articles

After downloading, go to the fabric -chart/ directory. 

  1. Editing “values.yaml” of the chart
  • Select the consensus algorithm: “consensusType” is used to configure consensus algorithm: solo or Kafka. Helm will render the deployment templates accordingly.
  • Modify the definition of organization: since the “crypto-config” directory generated in step 3 contains an hierarchy of subdirectories based on the file “cluster-config.yaml”, the same information needs to be included into “values.yaml” to ensure that Fabric nodes could find their certificate files correctly. The easiest way is to copy the content of the above “cluster-config.yaml” to “values.yaml”.
  • Configure the NFS server, add NFS server information to let Fabric nodes load their configuration files in the Kubernetes environment.

A sample “values.yaml” is as follows:

clusterName: mycluster

consensusType: solo

nfs:

ip: 10.192.10.10

basePath: /opt/share

ordererOrgs:

- name: orderer

domain: example.com

template:

count: 1

peerOrgs:

- name: org1

domain: org1.example.com

template:

count: 1

- name: org2

domain: org2.example.com

template:

count: 1


  1. Moving the certificates to NFS server

The certificate files generated in step 3 are stored in a directory called “crypto-config/”. To allow Fabric nodes to obtain the certificate information, the certificate files should be copied onto the NFS server so that the nodes can access the certificate files through PV (persistent volume).

For example, assuming that the directory exported by the NFS server is “/opt/share”, “crypto-config” should be placed in the following path:

“/opt/share/<clusterName>/resources/crypto-config”, where clusterName is used to distinguish different instances of Fabric cluster. In our sample values.yaml in step 5, the clusterName is mycluster.

  1. Deploying Chart to Kubernetes

After the above steps, use the following command to deploy the Fabric to the Kubernetes cluster:

$ helm install .

The architecture of Fabric on Kubernetes is as follows:

  1. Installation principles

Basically, the Fabric Chart contains a set of dynamitic deployment templates. Before the actual deployment of Fabric, Helm renders the Fabric Chart based on “value.yaml”. It then pushes the rendered deployment files to Tiller server,   Tiller calls the Kubernetes APIs and finishes the deployment eventually.

We take the template file (fabric-chart/templates/peer.yaml) of the Peer node as an example to briefly explain this process:

1)

{{- range $peerOrg := $root.Values.peerOrgs}}

In the definition of the template, each Org corresponds to a namespace in Kubernetes. Each peer is mapped to a Pod under its org’s namespace, therefore the rendering will iterate through all the Orgs.

2)

{{- $namespace := printf "%s-%s" $orgName $clusterName }}

{{- $scope := dict "name" $namespace }}

{{- template "namespace" $scope }}

Render the namespace for an Org in each iteration. The namespace takes the format of “org.name-clustName”.

3)

{{- $name := printf "%s-shared" $namespace }}

{{- $scope := dict "name" $name "nfsServer" $root.Values.nfs.ip "nfsPath" $nfsPath "pvcNamespace" $namespace "pvcName" $sharedPVCName }}

{{- template "persistentVolume" $scope }}

The same as the iteration described above, render the Persistent Volume and Persistent Volume Claim for Pods within the same namespace.

4)

{{- range $index := until ($peerOrg.template.count | int) }}

{{- $name := printf "peer%d" $index }}

{{- $scope := dict "name" $name "namespace" $namespace "orgName" $orgName "orgDomainName" $orgDomainName "pvc" $sharedPVCName }}

{{- template "peer.deployment" $scope }}

{{- $name := printf "peer%d" $index }}

{{- $scope := dict "name" $name "namespace" $namespace }}

{{- template "peer.service" $scope }}

Finally, the deployment file of the Peer node will be rendered according to the Organization’s information. The deployment file is consisted of Kubernetes resources, such as deployment, service and ingress.

The templates also define other Fabric components like Orderer, CA and CLI. Readers can find them in fabric-chart/templates.

Related blogs:

Deploy Hyperledger Fabric on Kubernetes Part 1

Deploy Hyperledger Fabric on Kubernetes Part 2

Related Information:

A tool (including Blockchain Explorer) to automate the deployment Fabric on Kubernetes can be found at here.

Deploy Hyperledger Fabric on Kubernetes Part 2

In last post, we introduced the mechanism of running Fabric on Kubernetes. This post continues with the details.

Download automation scripts

Let’s assume there is an instance of Kubernetes ready for running Fabric. There are a few scripts we use for the following steps. Download them here:

https://github.com/hainingzhang/articles/tree/master/fabric_on_kubernetes/Fabric-on-K8S/setupCluster

The downloaded scripts in Fabric-on-k8s/ folder are as follows:

Fabric-on-k8s
 |--README.md
 |--setupCluster
 |--generateALL.sh             // for generating the K8S deployment file
 |--transform                  // run kubectl relative commands
 |--templates                  // store templates
 |--cluster-config.yaml        // config Fabric cluster
 |--configtx.yaml              // config channel

Configuration files of Fabric

We need to edit two configuration files in the Fabric-on-k8s/ folder to define the Fabric cluster to be deployed:

A. cluster-config.yaml

The cryptogen tool generates certificates for Fabric members based on cluster-config.yaml. An example is as follows:

OrdererOrgs:
 - Name: Orderer

Domain: orgorderer1
     Template:
       Count: 1
  
 PeerOrgs:
 - Name: Org1
     Domain: org1
     Template:­
       Count: 2­­
  
 - Name: Org2
     Domain: org2
     Template:
       Count: 2

Two keywords OrdererOrgs and PeerOrgs specify the type of organization:

1) OrdererOrgs defines an organization with the name Orderer and the domain name orgorderer1. The value of Count under Template is 1. It means only one orderer is under the organization. Its id is orderer0.

2) PeerOrgs defines two organizations: Org1 and Org2. The corresponding domain names are org1 and org2, respectively. As specified by the value of Count, each organization has two peers, namely peer0 and peer1. Peer0 of org1 and peer0 of org2 have the same ID, but they could be distinguished easily by domain name, e.g. peer0.org1 and peer0.org2.

Note: Since the namespace of Kubernetes does not support ‘.’ and uppercase letters, the domain names of each organization should follow the same rule.

For more information on how to customize cluster-config.yaml, please refer to the source code of cryptogen (fabric/common/tools/cryptogen/main.go) .

From the file cluster-config.yaml, cryptogen will generate crypto-config/ directory as follows:

crypto-config
|--- ordererOrganizations
|    |--- orgorderer1
|           |--- msp
|           |--- ca
|           |--- tlsca
|           |--- users
|           |--- orderers
|           |--- orderer0.orgorderer1
|                 |--- msp
|                 |--- tls
|
|--- peerOrganizations
      |--- org1
      |     |--- msp
      |     |--- ca
      |     |--- tlsca
      |     |--- users
      |     |--- peers
      |           |--- peer0.org1
      |           |     |--- msp
      |           |     |--- tls
      |           |--- peer1.org1
      |                 |--- msp
      |                 |--- tls
      |--- org2
            |--- msp
            |--- ca
            |--- tlsca
            |--- users
            |--- peers
                   |--- peer0.org2
                   |     |--- msp
                   |     |--- tls
                   |--- peer1.org2
                         |--- msp
                         |--- tls

 B. configtx.yaml

The tool configtxgen will generate genesis block according to configtx.yaml. The genesis block is used to boot up orderer and restrict permission of channel creation. We need to modify configtx.yaml to generate the appropriate genesis block according to the definition of organizations in cluster-config.yaml.

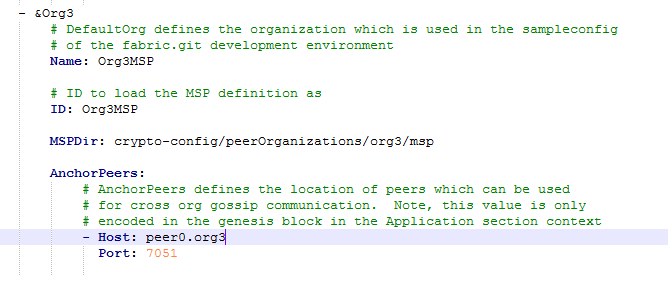
For example, if we add an Org3 to cluster-config.yaml and prepare to create a channel that contains Org1, Org2, Org3, we should modify configtx.yaml by the following two steps:

  1. Add Org3 to yaml:

  1. Add Org3 to Organizations section:

Template files of Kubernetes

While deploying Fabric on Kubernetes, we need to create appropriate configuration files for namespaces and pods which Fabric components are mapped to. Considering there could be many nodes in a Fabric cluster, it is complicated and error-prone to manually create these files. Fortunately, we can automate this process by using some scripts. Five templates serve as the cookie cutter to generate configuration files. They can be found in the templates directory of the downloaded sample code. The function of templates are as follows:

a) fabric_1_0_tmeplate_namespace.yaml
Define the namespace of the Fabric cluster in Kubernetes, which corresponds to the domain name of the organization.

b) fabric_1_0_template_cli.yaml
CLI pod deployment template for each namespace. The CLI pod provides a command line interface for managing all the peers within the organization, e.g. the creation of the channel and chaincode installation.

c) fabric_1_0_template_ca.yaml
The deployment template for the CA service of the Fabric. It is used for certificate management in the organization.

d) fabcric_1_0_template_orderer.yaml
Deployment template of orderer. It should be noted that cryptogen does not generate genesis block which the orderder replies on to start. Thus it’s necessary to prepare genesis block before booting up the orderer.

e) fabric_1_0_template_peer.yaml
Deployment template of peers. When instantiating a chaincode, peer needs to connect to the Docker endpoint to create the chaincode container. For this reason, the var/run/docker.sock of the host is mapped into the peer container.

Deploying Fabric onto Kubernetes

The following operations are performed on the CMD client in Figure 1. The shared directory of NFS is /opt/share. The directory on NFS should be owned by nobody:nogroup.

  • Generating startup files 

a)  Mount the shared directory of NFS to /opt/share of local host.

b) Change to the Fabric-on-K8S/ directory. Use the following command to download Fabric cryptogen and other tools:

$ curl https://nexus.hyperledger.org/content/repositories/releases/org/hyperledger/fabric/hyperledger-fabric/linux-amd64-1.0.0/hyperledger-fabric-linux-amd64-1.0.0.tar.gz | tar xz

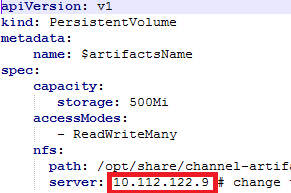
c) Change the NFS address of templates/fabric_1_0_template_pod_cli.yaml to your own NFS server, as shown in Figure 7:

Figure 7

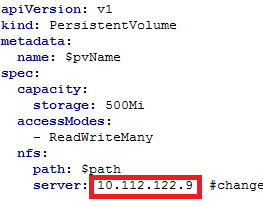
d) Edit templates/fabric_1_0_template_pod_namespace.yaml and modify the address of NFS as shown in Figure 8:

Figure 8

e) By default, cluster-config.yaml define two peer organizations and one orderer organization. Each peer organization has two peers. and orderer organization has only one orderer. We can add more organizations by modifying cluster-config.yaml.

f) Generate startup files by the following command:

$ sudo bash generateAll.sh


  • Running startup script 

Start the Fabric cluster with the following command (PyYAML-3.5 is required): 

$ python3.5 transform/run.py

For each PeerOrganization orgN (N=1,2,3…), the workflow of run.py runs as follows:

  • Create orgN namespace in Kubernetes;
  • Create CA pod under orgN namespace;
  • Create CLI pod under orgN namespace;
  • Traverse the subdirectory of orgN/peers to find the corresponding yaml files and start all pods of the peers.

For each OrdererOrganization ordererorgN (N=1,2,3…), the workflow of run.py runs as follows:

  • Create ordererorgN namespace in Kubernetes;
  • Traverse the subdirectory of ordererorgN/orderers to find the corresponding yaml files and start all orderers.


  • Checking cluster status 

After starting the cluster, use the following command to check the status of all pods:

$ kubectl get pods --all-namespaces

When all pods are displayed as running, all components are working properly. Figure 9 is an example of the command output:

Figure 9

 Testing the cluster

Assume we have deployed and started a Fabric cluster with the default cluster-config.yaml. Next, we will do some tests to verify the fabric cluster is working properly.

At first, we use the configtx tool to generate channel-related files to create and join a channel:

[1]  Go to Fabric-on-K8S/setupCluster/ directory of the CMD client:

$ cd Fabric-on-K8S/setupCluster/

[2]  Create the file channel.tx, where the channel ID is mychannel:

$ ../bin/configtxgen -profile TwoOrgsChannel -outputCreateChannelTx \

./channel-artifacts/channel.tx -channelID mychannel

[3]  Create an upgrade file for the channel which updates the anchor of Org1 in mychannel:

$ ../bin/configtxgen -profile TwoOrgsChannel -outputAnchorPeersUpdate \
./channel-artifacts/Org1MSPanchors.tx -channelID mychannel -asOrg Org1MSP

[4]  Create an upgrade file for the channel which updates the anchor of Org2 in mychannel:

$ ../bin/configtxgen -profile TwoOrgsChannel -outputAnchorPeersUpdate \
./channel-artifacts/Org2MSPanchors.tx -channelID mychannel -asOrg Org2MSP

[5]  Since each Org’s CLI Pod needs to use the files created in the above steps, we can share these files with CLI Pod via NFS:

$ sudo cp -r ./channel-artifacts /opt/share/

 After completing the above work, we enter the command prompt of CLI Pod of org1. From there we run commands as follows:

A)   List all pods under org1 namespace:

$ kubectl get pods --namespace org1

As shown in Figure 10, we found out the CLI Pod of org1 is cli-2586364563-vclmr.

Figure 10

B) Enter the cli container’s command prompt:

$ kubectl exec -it cli-2586364563-vclmr bash --namespace=org1

C) Create a channel named mychannel:

$ peer channel create -o orderer0.orgorderer1: 7050 \  
 -c mychannel -f ./channel-artifacts/channel.tx

D)   Copy mychannel.block to channel-artifacts/ directory:

$ cp mychannel.block ./channel-artifacts

E)    The peer joins mychannel:

$ peer channel join -b ./channel-artifacts/mychannel.block

F)    Update the anchor peer. Each organization only needs to execute this command once:

$ peer channel update -o orderer0.orgorderer1: 7050 \   

-c mychannel -f ./channel-artifacts/Org1MSPanchors.tx

G)   Download the chaincode_example02/ directory of the Fabric project from Github. Place it in the /opt/share/channel-artifacts directory of the CMD client.

H)   Install the chaincode named mycc:

$ peer chaincode install -n mycc -v 1.0 –p \
github.com/hyperledger/fabric/peer/channel-artifacts/chaincode_example02

I)  Instantiate the chaincode mycc:

$ peer chaincode instantiate -o orderer0.orgorderer1: 7050 \
-C "mychannel -n mycc -v 1.0 -c \
'{" Args ": [" init "," a "," 100 "," b "," 200"]}' \
-P "OR ('Org1MSP.member', 'Org2MSP.member')"

After mycc is instantiated, we can switch to other organization’s CLI Pod by adding the same channel and other steps to verify whether the ledger has synchronized.

Externally invoking Fabric

Now that the Fabric cluster is up and running. However, it is only accessible from the Kubernetes’ network. To expose its service to external network, we should configure Kubernetes to accept external requests. To do that, the service type is defined as NodePort. The port mapping rules are described as follows ( N=1,2,3…. , and M = 0,1,2,3…):

1. The port range of orgN is 30000 + (N-1) * 100 ~ 30000 + (N) * 100-1 .  Each organization can be assigned up to 100 port numbers. For example, org1’s port range is 30000 to 30099 .

2. The mapping of CA’s port 7054 is as follows:

ca.orgN: 7054 -> worker: 30000+ (N-1) * 100

3. Because each peer needs to expose both port 7051 and 7052, the port mapping of peerM in orgN is as follows:

peerM.orgN: 7051 -> worker: 30000+ (N-1) * 100 + 2 * M + 1

peerM.orgN: 7052 -> worker: 30000+ (N-1) * 100 + 2 * M + 2

For example: if a worker node of Kubernetes has an IP address of 192.168.0.7.  We can access peer0.org1 through the 192.168.0.7:30001 (the peer’s port 7051).

4. The port of the ordererN:

ordererN: 7050 -> worker: 33700 + N

Note: NodePort is a way to expose service in Kubernetes. However, it occupies the same ports in the whole Kubernetes cluster. This may not work well in some situations. Refer to Kubernetes’ document for other approaches.

Deleting Fabric cluster

When we want to delete the Fabric cluster, run the transform/delete.py script to clean up the environment. The script will traverse the crypto-config directory and find out all the yaml files. It then removes the resources one by one by command “kuberclt delete-f xxx.yaml”.

Conclusion

In this 2-part blog posts, we walked through the mechanism and process of deploying Fabric on Kubernetes. While there could be improvement over our approach, we hope it shows a way to leverage Kubernetes for blockchain applications. Our approach has been used in a tool called “Blockchain on vSphere”. It is an automation tool that allow you to deploy Fabric on Kubernetes (and vSphere) with minimum configuration. You are welcome to try it out and give us feedback.

About the Authors:

Henry Zhang: Chief Architect of VMware China R&D, the creator of open source Project Harbor (https://github.com/vmware/harbor) – an enterprise class container registry server. Henry is a co-author of the book “Blockchain Technical Guide”. He is also a contributor of Hyperledger Cello project.

Luke Chen: MTS intern at VMware China R&D. He is a master student at Guangzhou University. He is a contributor of Hyperledger Cello project.

Deploy Hyperledger Fabric on Kubernetes Part 1

Overview

Fabric is one of the Hyperledger projects hosted by the Linux Foundation. It provides a framework to develop blockchain applications. Since the release of Fabric 1.0 in this July, people are eager to build applications using Fabric to solve their business problems. However, many encounter difficulties in deploying and managing the Fabric system due to the complexity of Fabric in configuration.

To simplify the operation of Fabric, we need some tools to help us better manage the distributed system of Fabric. Kubernetes seems ideal for this purpose for several reasons. (It is interesting to note that Kubernetes is a flagship project under CNCF, which is also a Linux Foundation project.)

First, Fabric’s bits are built into container images. Its chaincode (smart contract) also leverages container to run in a sandbox. The Fabric system consists of components running in multiple containers. On the other hand, Kubernetes is becoming the dominant platform to automate the deployment, scaling, and other management of containerized applications. There is a natural fit of the two.

Second, Fabric components can achieve high availability by deploying on Kubernetes. Kubernetes has a feature called replicator, which monitors running pods and brings up crashed ones automatically.

Third, Kubernetes supports multi-tenancy. We can run multiple isolated Fabric instances on the same Kubernetes platform. This facilitates the development and testing of blockchain applications.

In the following sections, we introduce a way to deploy Fabric on Kubernetes. We assume readers have basic knowledge of Fabric, Docker container and Kubernetes.

Network Topology

Our network topology is shown in Figure 1. The physical network is represented by blue lines. Kubernetes has one or more master and worker nodes. Besides that, we have a CMD machine as a client to issue the deployment commands. An NFS server is used as a shared file system for configuration files and other data. All these nodes are connected by a physical network (e.g. 192.168.0.1/24).

Kubernetes’ network model enables all pods to connect to each other directly regardless which node they are on. By using Kubernetes’ CNI addons, such as Flannel, it’s easy to create an overlay network for this purpose. As indicated by the red lines in Figure 1 (some details of flannel components are omitted), Kubernetes connects all pods to the Flannel network, allowing containers of those pods to communicate with each other properly.

The IP address range of the Flannel network, as well as the IP address of the kube_dns can be specified in the add-on configuration file. We need to make sure the IP address of kube_dns must be in the specified address range. In Figure 1, for example, the Flannel network is 10.0.0.1/16, and the kube_dns address is 10.0.0.10.

Figure 1

Mapping Fabric Components to Kubernetes Pods

Figure 2

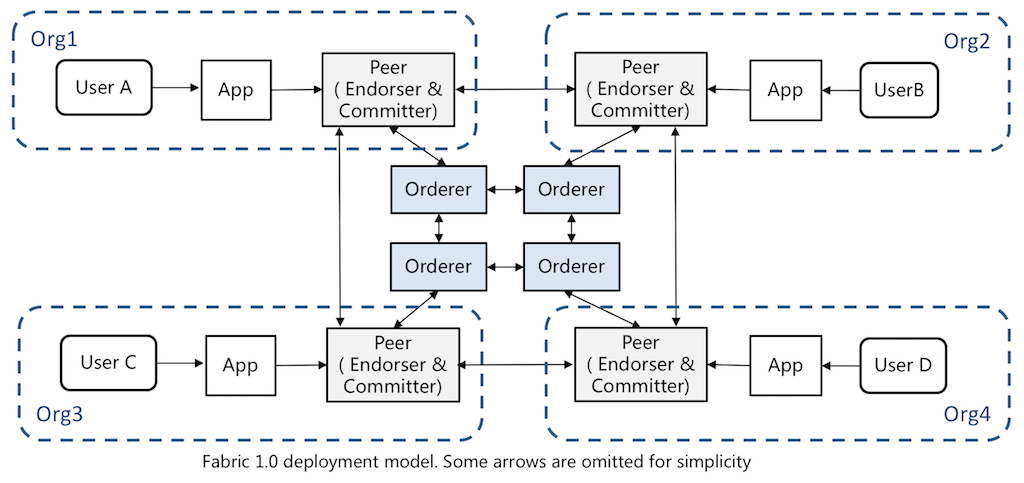
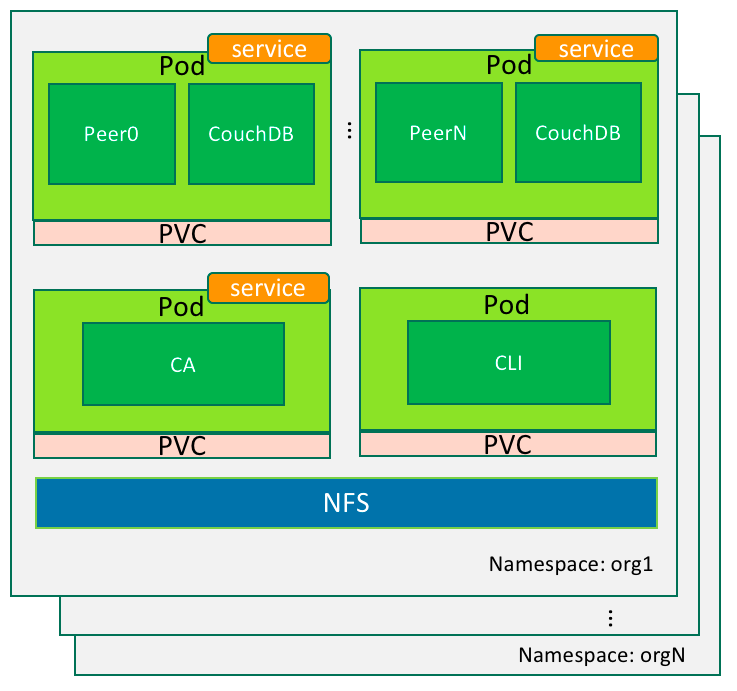
Fabric is a distributed system which contains multiple nodes. The nodes could belong to different entities. As shown in Figure 2, each organization has its own set of nodes (For simplicity, not all nodes are shown). There is also a public consensus service formed by Orderers. To deploy Fabric onto Kubernetes, we need to convert all components into pods for deployment and use namespace to segregate organizations.

In Kubernetes, namespace is an important concept. It is used to divide cluster resources between multiple users. In the case of Fabric, organizations can be mapped into namespaces so that they have their dedicated resource. After this mapping, peers of each organization can be distinguished by domain name. Furthermore, we could isolate different organizations by setting network policy (not covered in this blog).

As shown in Figure 2, suppose there are N peer organizations and M orderer organizations in the Fabric network. Here’s how we divide them on Kubernetes:

A) If Fabric, we assign the N-th peer organization with a name orgN. Its corresponding namespace in Kubernetes is also called orgN. All components of Fabric orgN will be placed into namespace orgN in Kubernetes. There are multiple pods under each organization’s namespace. A pod is a deployment unit in Kubernetes, it consists of one or more containers. We can bundle Fabric containers of each organization into several pods. These pod types are as follows:

  • Peer Pod: including Fabric peer, couchDB (optional), representing the organization’s peer node. Each organization could have one or more peer pods.
  • CA Server Pod: Fabric CA Server node of the organization. Usually one pod is needed in an organization.
  • CLI Pod: (optional) Provides an environment for command-line tools to manipulate the nodes of the organization. Fabric’s peer environment variables are configured in this pod.

Figure 3

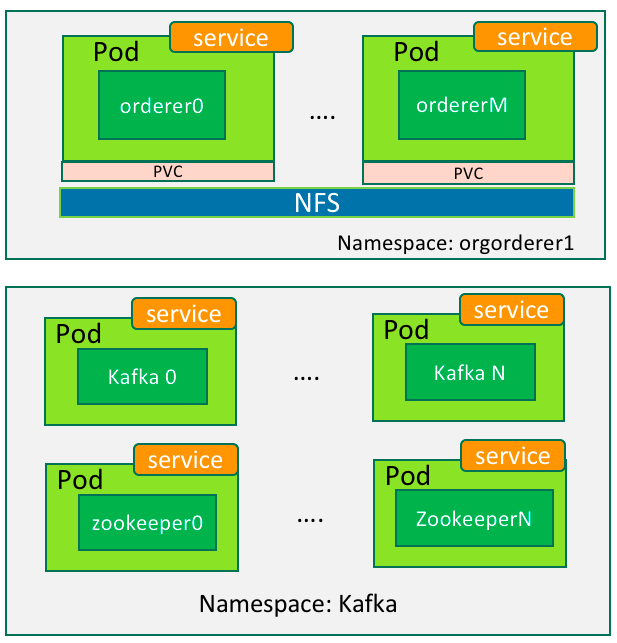
B) There could be one or more orderers in Fabric. We set the name of the M-th orderer organization to orgordererM. Its corresponding namespace on Kubernetes is orgordererM. It has one or more pods to run the orderer node(s).

Figure 4

C) If Kafka is used for consensus process, we can put Kafka into a separate namespace. It is only used to run and manage Zookeeper and Kafka containers.

Putting it altogether, the overall deployment would look like below:

Figure 5

Shared storage

Before we deploy Fabric, we need to prepare configuration files of its components, such as peers and orderers. This is a very complicated process and tends to be error prone. Fortunately, we created a tool to automate the generation of these configuration files. The generated files are stored in a shared file system like NFS.

When we later launch the pods of Fabric, we mount different subsets of configuration files into pods so that they have configuration specific to the organization they belong to.

In Kubernetes, we can mount files or directories into a pod by using Persistent Volume (PV) and Persistent Volume Claim (PVC). We create PVs and PVCs for each organization in Fabric for resource isolation. Each organization should only see its own directory in NFS server.

After the creation of PV, we define PVC so that Fabric nodes can consume PV to access the corresponding directories and files.

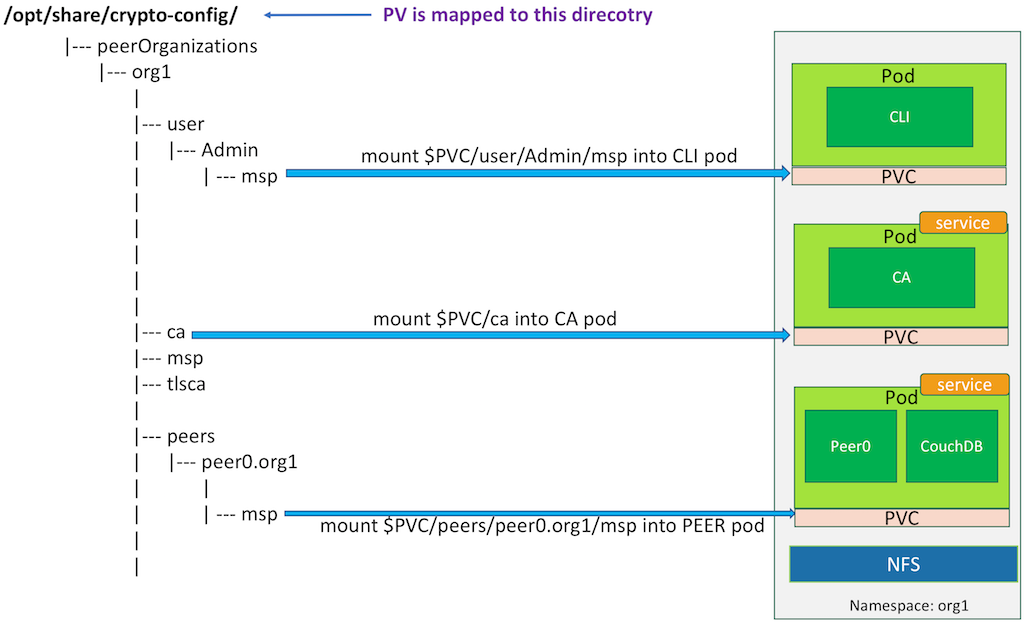
Take peer organization org1 as an example. At first, we create a namespace org1 and its PV. The PV is mapped to the directory /opt/share/crypto-config/peerOrganizations/org1 on NFS. Secondly, we create a PVC to consume the PV. All pods under the namespace org1 use the same PVC. However, we only map necessary files into each pod by specifying the mounting path in the pod configuration file.

Figure 6 shows the relationship between pods and their shared directory of NFS. Variable $PVC represents the PVC mount point, which is /opt/share/crypto-config/peerOrganizations/org1 in this example.

Figure 6

Communication between Fabric components

When all Fabric’s components are placed into Kubernetes’ pods, we need to consider the network connectivity between these pods. Each pod in Kubernetes has an internal IP address, but it is hard to use IP and port to communicate between pods because the IP address is ephemeral to the pod. When the pod gets restarted, its IP address gets changed too. Therefore, it is necessary to create services in Kubernetes for pods so that they can talk to each other through service name. The naming of a service should follow the principles to show the pod information that it binds to:

1) The namespace of the service and the pod should be consistent.
2) The name of the service should be consistent with the id of the container within the pod.

Fabric’s peer0 of organization org1, for example, is mapped to a pod named peer0 under namespace org1. The service binding to it should be named peer0.org1, where peer0 is the name of the service and org1 is the namespace of the service. Other pods can connect to the peer0 of org1 by service name peer0.org1, which appears as peer0’s hostname.

Work around the chaincode sandbox

When a peer in Fabric instantiates a chaincode, it creates a Docker container in which the chaincode runs. The Docker API endpoint it invokes to create the container is unix:///var/run/docker.sock . This mechanism works well as long as the peer container and the chaincode container are managed by the same Docker engine. However, in Kubernetes, the chaincode container is created by the peer without notifying Kubernetes. Hence the chaincode and peer containers cannot connect to each other which results in failure when instantiating the chaincode.

To work around this problem, we need to add the Kube_dns IP address in each worker node’s Docker engine. Add in the below option in Docker engine’s configuration file. In the below example, 10.0.0.10 is the IP address of kube_dns pod. Replace it with the right value in your environment.

"--dns=10.0.0.10 --dns=192.168.0.1 --dns-search \
default.svc.cluster.local --dns-search \
svc.cluster.local --dns-opt ndots:2 --dns-opt \
timeout:2 --dns-opt attempts:2 "

Up to now, we have illustrated the key points in deploying Fabric onto Kubernetes. In the next post, we will describe detailed steps of the deployment. For people who cannot wait, please download our Fling “Blockchain on vSphere” to get a feel of how it works. It is an automation tool that allow you to deploy Fabric on Kubernetes with minimum configuration. If you do not use vSphere to run Kubernetes, you can choose whatever underlying infrastructure for your Kubernetes instance. Just skip the part to deploy Kubernetes on vSphere.

Continue with Part 2:

Deploy Hyperledger Fabric on Kubernetes Part 2


About the Authors:

Henry Zhang: Chief Architect of VMware China R&D, the creator of open source Project Harbor (https://github.com/vmware/harbor) – an enterprise class container registry server. Henry is a co-author of the book “Blockchain Technical Guide”. He is also a contributor of Hyperledger Cello project.

Luke Chen: MTS intern at VMware China R&D. He is a master student at Guangzhou University. He is a contributor of Hyperledger Cello project.

Harbor Private Registry: Image Vulnerability Scanning Demo

The popular open source Harbor registry has released a new version 1.2. In this version, it introduces a new feature called Vulnerability Scanning. It can scan through the images stored in Harbor and report any vulnerability found in images. The vulnerability has a few level of severity: normal, low, medium and high. The administrator of Harbor can set a threshold, e.g. High, so that any images with vulnerabilities equal to or above that level will be rejected from pulling. This ensure the images with vulnerability cannot be used in a production or other environment.

The scanning actually goes through all files of a container image and shows how many packages are found with problems and the level of security risk. This is quite straightforward for an administrator to understand the risk inside an image.

The scanning happens when an image has been pushed to a Harbor private registry. The scanning can also be scheduled at a specified time, e.g. at the mid night everyday, to reduce the resource consumption during the peak hours of a day.

Harbor leverages Clair project for this vulnerability scanning feature. It automatically checks for update from a few CVE sources. When an update in CVE database is found, it downloads the data and use it in the next scan.

Here is a demo of the vulnerability scanning feature.

If you are interested in this scanning feature, you can download the latest version of Harbor Registry and try it out.


The Inspiration Behind Open Source Project Harbor

About Project Harbor

Project Harbor is an enterprise-class registry server that stores and distributes Docker images. Harbor extends the open source Docker Distribution by adding the functionalities usually required by an enterprise, such as security, identity and replication.

The Inspiration Behind Project Harbor

When I attended container meetups and conferences in early 2014, I often heard people complaining about container image management challenges. They usually created various hacks or workarounds to solve their problems. When I saw pain points like these, I had a gut feeling there would be a great opportunity to create a solution addressing these challenges. Shortly after these discussions, we started a side project for managing container images. And that’s where Project Harbor began.

Why We Chose to Open Source Project Harbor

Originally, we dogfooded our project within the VMware China R&D Center. We used Harbor in a few internal projects and received positive feedback from our teams. In March 2016, we ultimately decided to open source Project Harbor on Github for larger adoption and more feedback.

How We Landed On the Name “Harbor”

We chose a name related to containers. Harbor is a place where containers are loaded on or unloaded from ships. Moreover, the word “Harbor” is simple and can be easily pronounced and remembered, making it a strong choice for project promotion.

The People Behind Project Harbor

At the beginning, only about six people were involved with the project—mostly engineers and interns in our Advanced Technology Center (ATC) team at VMware China R&D. Gradually, community users started to join forces with us, collaborating to help improve the project. Currently, there are approximately 50 contributors, and about two-thirds are outside of VMware.

Project Harbor Momentum

Since Project Harbor was open sourced last year, it gained significant traction in terms of adoption and new contributors. I think Project Harbor has seen substantial momentum due to many factors. First, it hit the pain points and solved many container user problems. Second, Harbor is open source and has an open community mindset; our actions reflect constant user feedback and suggestions to ensure improvement. We also work with partners in the ecosystem to build products or create solutions using Harbor. Third, we promoted Harbor through social media channels, like WeChat, blogs and Twitter.

I look forward to sharing more about Project Harbor, answering any community questions and sharing my thoughts on other open source projects in the future.

This blog was originally posted at

https://blogs.vmware.com/opensource/2017/07/19/the-inspiration-behind-open-source-project-harbor/

Project Harbor Reached Milestone of 2000 Stars on Github

About a year ago, I gave the first star to an open source project we created. In less than 13 months, the project has reached an exciting milestone of 2000 stars!  This project is called Harbor, an enterprise class registry server.

People from different countries starred Project Harbor on Github

Back in early 2014, when I attended Docker meetups and container conferences, I often heard people complaining about the challenges to manage container images. They usually created all kinds of hacks or workarounds to solve their own problems. When I saw pain points like these, my gut feeling told me that it must be a great opportunity to do something to it.

We then started to work on a side project to help people manage image effectively. This project became the prototype of Harbor. It was used by a few project teams and turned out to be quite helpful. In March 2016, we decided to open source it on Github for larger adoption. Since then, Project Harbor has taken off and been gaining more and more traction. We listened to feedback from the community and kept improving it. Community developers were enthusiastic and they contributed code, tools, documentation and even translation to multiple languages to the project. Two third of the contributors was actually from outside of VMware.

Gradually, Harbor becomes one of the most popular open source registries and has been widely used by people in the container space. VMware has also integrated Harbor into two products: vSphere Integrated Containers and Photon Platform. Many users run Harbor in their production, such as one of the largest internet companies, JD.com in China. Other companies also forked Harbor and used in their own products. Below are some statistics of Project Harbor.

Project Harbor Statistics

The current version of Harbor provides some important features to enterprise users, such as RBAC (Role Based Access Control), LDAP/AD authentication, image remote replication, management portal. In the coming new release, Harbor will be adding new features like Notary and a new admin UI.

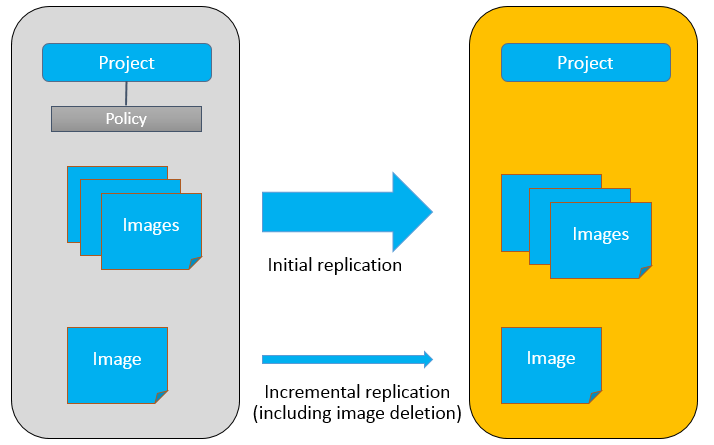
One of my favorite features of Harbor: Remote replication (synchronization) of images

While we are celebrating the milestone of Harbor, it certainly serves as a new starting point to us. Thanks everyone who contributed to Harbor’s success. Your continuous support definitely motivates us to make Harbor the best home for your container images!

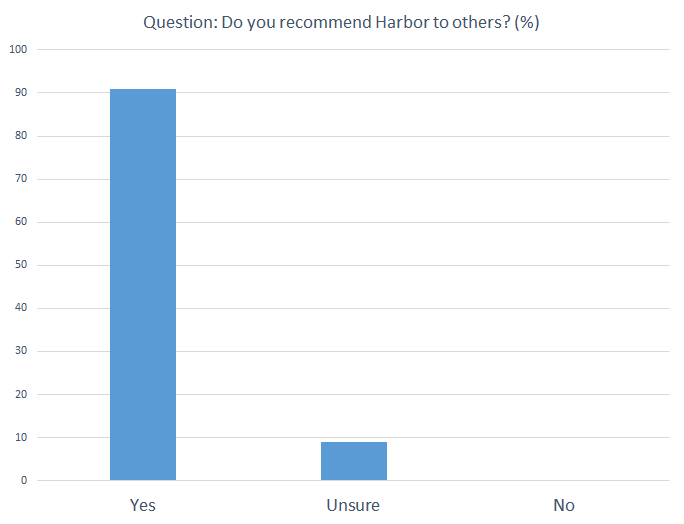
Survey based on user community, 53 responses

Related Topics:

Architecture of Harbor: An Open Source Enterprise-class Registry Server
Private Docker Registry Harbor Achieves HA based on Virtual SAN
Working with Harbor Registry REST API via Swagger

Private Docker Registry Harbor Achieves HA based on Virtual SAN

Recently, VMware released the Docker Volume Driver for vSphere 1.0 beta, which enabled a Docker host to create volumes directly on a vSphere datastore (Virtual SAN, VMFS, NFS, etc). The volumes can be directly mounted into Docker containers. The Docker volume solves the problem of storing persistent data of Docker containers. The Docker Volume of vSphere not only simplifies storage configuration, the volumes can also be associated with the Storage Policy Based Management (SPBM) of vSphere. For example, an administrator can set Fault To Tolerant (FTT) or Stripe Width (SW) of the data volume. Volumes with SPBM can achieve a higher data protection level and better performance. The docker volume driver of vSphere is an open-source project. It is downloadable at https://github.com/vmware/docker-volume-vsphere .

This blog walks through the steps of creating data volumes in VMware Virtual SAN (VSAN). As an example of a containerized application, the open source Harbor Registry is used to describe the usage of data volumes provisioned by VSAN, through which Harbor Registry achieves a higher data protection level and high availability (HA).

A little more background about Harbor Registry: it is another open-source project by VMware. A registry is one of the necessary components of a container’s build-ship-run lifecycle. Harbor helps users set up an enterprise private Docker registry service rapidly. Furthermore, it also provides enhanced features usually required by enterprises such as graphical user interface (GUI), role based access control, AD/LDAP integration and image replication. Harbor’s Github repo: https://github.com/vmware/harbor .

vsanharborha1The architecture of the system is illustrated in the above figure. 3 ESXi hosts form a VSAN cluster. A Harbor registry VM is running on one of the hosts. Besides, there are three external Docker volumes created in the VSAN cluster, used for storing persistent data in Harbor. This cluster provides consolidated storage by local disks of each host. It can tolerate a failure of one physical host and still preserve data integrity and accessibility.

The configuration process is discussed as follows.
1.    First, set up a Virtual SAN cluster with 3 ESXi hosts. A photon OS VM ( https://vmware.github.io/photon/ ) is installed on one of the ESXi server as a Docker host. Of course, other Linux distributions like Ubuntu can be used as well, as long as it can run Docker Engine and Docker Compose.

t12.    On the release page of Docker Volume Driver for vSphere project (https://github.com/vmware/docker-volume-vsphere/releases), download the plugin for ESXi host and for VMs respectively. For example, for 1.0 beta, the file names are:

vmware-esx-vmdkops-1.0.beta.zip
docker-volume-vsphere-1.0.beta-1.x86_64.rpm

3.    On each of the ESXi hosts, use the following commands to install the plugin (SSH of ESXi host must be enabled). After installation, no reboot is required.

# esxcli software vib install -d "/vmware-esx-vmdkops-1.0.beta.zip" \
--no-sig-check –f
Installation Result
Message: Operation finished successfully.
Reboot Required: false
VIBs Installed: VMWare_bootbank_esx-vmdkops-service_1.0.0-0.0.1
VIBs Removed:
VIBs Skipped:

4.    On the Photon VM, install the RPM package. For other Debian based OS, install the corresponding deb package.

# rpm -ivh docker-volume-vsphere-1.0.beta-1.x86_64.rpm
Preparing...                              ##################### [100%]
Updating / installing...
1:docker-volume-vsphere-0:1.0.beta-############################ [100%]
File: '/proc/1/exe' -> '/usr/lib/systemd/systemd'
Created symlink from /etc/systemd/system/multi-user.target.wants/\
docker-volume-vsphere.service to /usr/lib/systemd/system/
docker-volume-vsphere.service.

5.    After the ESXi plugin is installed, a management script is generated at /usr/lib/vmware/vmdkops/bin/vmdkops_admin.py. This script helps administrators manage the data volumes. For example, an administrator can create different storage policies. In Virtual SAN, the default storage policy has a Stripe Width setting of 1 (SW=1). We will create a new policy with SW=2 as an example.
To do this, just SSH into any of the ESXi hosts and run this command:

# /usr/lib/vmware/vmdkops/bin/vmdkops_admin.py policy \
create --name SW=2 --content '(("stripeWidth" i2))'

The parameter ‘SW=2’ is the name of the policy. The key point here is to set the content of the policy and it is ‘((“stripeWidth” i2))’ in this example. Other settings are the same as the Virtual SAN policy parameters. The possible parameters and their description are as follows:spbm6.    Now Docker volumes can be created on the Docker host (the Photon OS VM). As an example, we first create two volumes with default storage policy and then create another volume with the newly created ‘SW=2’ policy.

# docker volume create --driver=vmdk --name=vsanvol1 -o size=50gb
vsanvol1
# docker volume create --driver=vmdk --name=vsanvol2 -o size=20gb
vsanvol2
# docker volume create --driver=vmdk --name=vsanvol3 -o size=20gb \
-o vsan-policy-name=SW=2
vsanvol3

By specifying the ‘–driver=vmdk’ parameter, the external volume is created in the vSphere datastore. The volume is created in the same datastore where the Photon OS VM resides. In this example the Photon OS VM is stored in Virtual SAN, so are the Docker volumes. These volumes are stored in the form of VMDK. What is noteworthy here is that the volumes are not mounted to any VM by now. So if we navigate to the vSphere Web Client, we cannot find any information about these newly created volumes from the VM’s page.t2However, we can indeed find them in the dockvols directory in the Virtual SAN datastore.t3In subsequent sections, we are able to find the VMDKs through the VM’s page when the volumes are mounted to running containers.

7.    On the Photon OS VM, download the Harbor Registry source code. Before installing Harbor, we need to modify the harbor/Deploy/docker-compose.yml configuration file in order to use the newly created external volumes. We can then install Harbor by following the official Harbor installation guide.

Open the docker-compose.yml file. Find the ‘registry’ section, modify these lines:

volumes:
  - /data/registry:/storage
  - ./config/registry/:/etc/registry/

to

volumes:
- vsanvol1:/storage
- ./config/registry/:/etc/registry/

vsanvol1 is the external volume we just created.
Next, look for the ‘mysql’ section and modify these lines:

volumes:
  - /data/database:/var/lib/mysql

to

volumes:
  - vsanvol2:/var/lib/mysql

Similarly, vsanvol2 is another volume we just created.
Next, look for the ‘jobservice’ section and modify these lines:

volumes:
  - /data/job_logs:/var/log/jobs
  - ./config/jobservice/app.conf:/etc/jobservice/app.conf

to

volumes:
  - vsanvol3:/var/log/jobs
  - ./config/jobservice/app.conf:/etc/jobservice/app.conf

Similarly, vsanvol3 is another volume we just created.
In the end of the file, add the following lines:

volumes:
  vsanvol1:
    external: true
  vsanvol2:
    external: true
  vsanvol3:
    external: true

These lines indicate that these volumes have already been created and do not need to be created by Docker again. Keep other configurations unchanged in the docker-compose.yml. Then install Harbor as the official guide and bring up Harbor registry service.

8.    After Harbor is running, we can check the vSphere Web Client and confirm that these 3 external volumes are indeed mounted to the Photon OS VM. They are mounted as ‘Hard Disk 2’,‘Hard Disk 3’ and ‘Hard Disk 4’ in the VM respectively. In this beta version, there seems some bugs about displaying storage policy. For example, the storage policies for these VMDKs are displayed as ‘None’ while we can see that ‘Hard Disk 3’ is created as ‘SW=2’ policy and the other two VMDKs are created with the default storage policy. The below screenshot shows a storage policy of ‘Hard Disk 4’:t5There may be a problem where Virtual SAN cannot identify the storage policy created by ‘” Docker Volume Driver for vSphere’ correctly. This problem should be solved in newer version.

9.    Let’s upload two images to test if there is any data loss when a host fails.t610.    Enable vSphere HA on this Virtual SAN cluster, with default HA settings. Then we identify that the Photon OS VM is on the ESXi host with IP address 10.162.102.130.t711.    Power off the physical host with IP address 10.162.102.130. Wait for a while after HA restarts the VM and check the state of Photon OS VM.t8The VM has been restarted on another heathy host. The original external volumes are mounted to the restarted VM. Because a host of the VSAN cluster is powered off, for each VMDK there will be a component shown as ‘absent’. However, with the default storage policy Virtual SAN can tolerate a host’s failure, so the access to the data is still successful.
12.    After Photon VM is restarted, check the status of Harbor. All the services and containers are running as normal.t1013.    Check Harbor UI, the 2 images we uploaded before are still intact. This indicates that there is no data loss.t11When vSphere HA restarted the Harbor VM on another healthy host, all the containers of Harbor are also restarted. They are connected to the original same volumes as in the figure:vsanharborha2This blog introduces an example of achieving Harbor registry HA by leveraging Virtual SAN and vSphere HA. Since Harbor is a multi-container application, this approach can also be applied to other container-based applications.

Related posts:

Architecture of Harbor: An Open Source Enterprise-class Registry Server

Working with Harbor Registry REST API via Swagger

Working with Harbor Registry REST API via Swagger

Swagger is the most popular RESTful API tool, it contains an entire set of codes, editors, code generators etc, and can be used in API descriptions, definitions, generation and visualization etc. For details about Swagger, see http://www.swagger.io, where you can download its source code and integrate it with the project.

Harbor is an enterprise-class private registry server initiated by VMware(http://github.com/vmware/harbor). Harbor also offers RESTful API which provides easy integration with other container management platforms. This article describes how to use Swagger tools embedded in Harbor to test RESTful APIs.

First, let’s take a look at how Swagger creates descriptions and definitions for RESTful API. Swagger provides an online WYSIWYG editor at http://editor.swagger.io/, users can enter Swagger-compatible YAML or JSON input on the left pane of the editor, and the result of the input will be shown on the right pane. If there are any input errors, there are alerts with amendment recommendations for the user, it’s very convenient! Refer to http://swagger.io/specification/ for instructions on writing definition files that are compatible with Swagger. This editor also supports the download of completed YAML to the local system, or conversion to JSON format. It can even help us auto-generate a Mockup Server or client.

Swagger Embedded in Harbor

Core functions of Harbor are implemented through RESTful API. A set of API rules that can be visualized was documented in Swagger during the development process and is provided for users as part of the project.

The Harbor Project utilizes two methods to let users present or control RESTFul API with Swagger.

The first is the “static” method, which only uses Swagger as the tool for presentations and reviews. Users only have to locate the swagger.yaml file from the directory docs/ of Project Harbor , and through the editor, open, select all, copy, and paste into the code pane on the left of Swagger online editor. The right pane will display a visualization of the Harbor RESTful API document page for review and reference.
article3_image1The second method is the “dynamic” method, which involves deploying Swagger UI and Harbor REST services in the same Server. Users can use Swagger to control and test Harbor RESTful APIs. This method may change data in the database, so it is not suggested to be used in production systems. Deployment procedures are illustrated in the figure below:article3_image2Under the directory docs/ of Harbor Project source codes, there is a script file named prepare-swagger.sh, which can help users carry out “dynamic” deployment. The following provides instructions on related steps. For detailed information, please refer to the file docs/configure_swagger.md:

(1) Change the SERVER_IP value in the script file, set it to the IP address of the host system of currently deployed Harbor system, save changes and execute the script. The script will download the Swagger software package accordingly and decompress it to the directory of static resources of Harbor Project vendors; copy the swagger.yaml files under docs/ to the Harbor Project static resource directory resources/yaml; change/replace URL contents according to the SERVER_IP provided by the user.

(2) Switch to the Deploy directory, change the file named “docker-compose.yml”, mount the newly-added Swagger static resource directory onto Harbor UI Docker container through Volumes, letting SwaggerUI deploy together with Harbor UI after starting up, to provide external access.

(3) Use the docker-compose command to re-create Project Harbor, clear all content left on the server, restart the newly created Project Harbor image.

The figure below shows a screenshot of a deployed Swagger UI page.
article3_image3article3_image4
RESTful API Authentication

When triggering Harbor RESTful API using Swagger UI, please be aware of “login status” issues, because some of API requires session information. There are two ways to configure a session.

Method 1: Open the UI with a browser (Note: Make sure that the IP address of the URL in the Harbor UI is the same as the value provided for SERVER_IP when deploying Swagger UI), complete the registration (if using for the first time) and login; then open a new (tab) in the same browser, enter the Swagger UI address below, this will ensure that HarborRESTful API is running when the user is logged in.

http://static/vendors/swagger/index.html

Method 2: Harbor RESTful API supports Basic Authentication mode. However, Swagger currently does not allow the input of usernames and passwords on its interface, so access becomes inconvenient. Those who are interested can follow this link https://github.com/swagger-api/swagger-ui and try to make Swagger accessible in Basic Authentication mode. Of course, the user can also use the below command to access API. In this way, the user does not have to log in to Harbor’s UI in order to test the API.

curl -u <username: password>

Related article:

Harbor Architecture Overview

Architecture of Harbor: An Open Source Enterprise-class Registry Server

About Project Harbor

VMware has initiated an enterprise-class Registry called Project Harbor, which helps users rapidly build a private enterprise-class registry service. It extends the open source Docker Distibution by adding the functionality usually required by an enterprise, such as management UI, Role Based Access Control(RBAC), AD/LDAP integration, image replication and auditing. The project has received over 1100 stars and been forked over 290 times since it was released 6 months ago. This article introduces the main modules of the Project Harbor and describes the operational principles behind Harbor.

Architecture

article1_image2

As depicted in the above diagram, Harbor comprises 6 components:

Proxy: Components of Harbor, such as registry, UI and token services, are all behind a reversed proxy. The proxy forwards requests from browsers and Docker clients to various backend services.

Registry: Responsible for storing Docker images and processing Docker push/pull commands. As Harbor needs to enforce access control to images, the Registry will direct clients to a token service to obtain a valid token for each pull or push request.

Core services: Harbor’s core functions, which mainly provides the following services:

  • UI: a graphical user interface to help users manage images on the Registry
  • Webhook: Webhook is a mechanism configured in the Registry so that image status changes in the Registry can be populated to the Webhook endpoint of Harbor. Harbor uses webhook to update logs, initiate replications, and some other functions.
  • Token service: Responsible for issuing a token for every docker push/pull command according to a user’s role of a project. If there is no token in a request sent from a Docker client, the Registry will redirect the request to the token service.

Database: Database stores the meta data of projects, users, roles, replication policies and images.

Job services: used for image replication, local images can be replicated(synchronized) to other Harbor instances.

Log collector: Responsible for collecting logs of other modules in a single place.

Implementation

Each component of Harbor is wrapped as a Docker container. Naturally, Harbor is deployed by Docker Compose.

In the source code (https://github.com/vmware/harbor), the Docker Compose template used to deploy Harbor is located at /Deployer/docker-compse.yml. Opening this template file reveals the 6 container components making up Harbor:

proxy: Reverse-proxy formed by the Nginx Server.

registry: Container instance created from the official image of Docker distribution.

ui: Core services within the architecture. This container is the main part of Project Harbor.

mysql: Database container created from the official MySql image.

job services: Replicating images to a remote registry via state machines. Image deletion can also be synchronized to a remote Harbor instance.

log: Container that runs rsyslogd, used for collecting logs from other containers through the log-driver mode.

These containers are linked via DNS service discovery in Docker. By this means, each container can be accessed by their names. For the end user, only the service port of the proxy (Nginx) needs to be revealed.

The following two examples of Docker command illustrate the interaction between Harbor’s components.

docker login

Suppose Harbor is deployed on a host with IP 192.168.1.10. A user runs the docker command to send a login request to Harbor:

$ docker login 192.168.1.10

After the user enters the required credentials, the Docker client sends an HTTP GET request to the address “192.168.1.10/v2/”. The different containers of Harbor will process it according to the following steps:

docker login(a) First, this request is received by the proxy container listening on port 80. Nginx in the container forwards the request to the Registry container at the backend.

(b) The Registry container has been configured for token-based authentication, so it returns an error code 401, notifying the Docker client to obtain a valid token from a specified URL. In Harbor, this URL points to the token service of Core Services;

(c) When the Docker client receives this error code, it sends a request to the token service URL, embedding username and password in the request header according to basic authentication of HTTP specification;

(d) After this request is sent to the proxy container via port 80, Nginx again forwards the request to the UI container according to pre-configured rules. The token service within the UI container receives the request, it decodes the request and obtains the username and password;

(e) After getting the username and password, the token service checks the database and authenticates the user by the data in the MySql database. When the token service is configured for LDAP/AD authentication, it authenticates against the external LDAP/AD server. After a successful authentication, the token service returns a HTTP code that indicates the success. The HTTP response body contains a token generated by a private key.

At this point, one docker login process has been completed. The Docker client saves the encoded username/password from step (c) locally in a hidden file.

docker Push

article1_image4(We have omitted proxy forwarding steps. The figure above illustrates communication between different components during the docker push process)

After the user logs in successfully, a Docker Image is sent to Harbor via a Docker Push command:

# docker push 192.168.1.10/library/hello-world

(a) Firstly, the docker client repeats the process similar to login by sending the request to the registry, and then gets back the URL of the token service;

(b) Subsequently, when contacting the token service, the Docker client provides additional information to apply for a token of the push operation on the image (library/hello-world);

(c) After receiving the request forwarded by Nginx, the token service queries the database to look up the user’s role and permissions to push the image. If the user has the proper permission, it encodes the information of the push operation and signs it with a private key and generates a token to the Docker client;

(d) After the Docker client gets the token, it sends a push request to the registry with a header containing the token. Once the Registry receives the request, it decodes the token with the public key and validates its content. The public key corresponds to the private key of the token service. If the registry finds the token valid for pushing the image, the image transferring process begins.

For more information about enterprise registry Harbor, take a look at Github: https://github.com/vmware/harbor

Building Cloud Foundry on vSphere using BOSH Part 4

Installing Cloud Foundry

In previous blogs, we set up a micro BOSH and a BOSH. We are ready to start our installation of Cloud Foundry. First thing first, we create a resource plan for our deployment.

As we are writing this document, a complete installation of Cloud Foundry contains about distinct 34 jobs (VMs). Some of the jobs are core components and at least one instance must be installed, such as Cloud Controller, NATS and DEAs. Some jobs should have multiple instances depending on the actual need, such as DEAs and routers. Some jobs are optional, such as service gateways and service nodes. Therefore, before we install Cloud Foundry, we should decide which components are included in a deployment.  Once we have a list of components we want to deploy, we can plan for resources needed by each job. Typically, this includes IP address, CPU, memory and storage. Below is an example of a deployment plan.

Job Instances   IP
Memory CPU Disk(GB) Required?
debian_nfs_server 1 xx.xx.xx.xx 2GB 2 16 required
nats 1 xx.xx.xx.xx 1GB 1 8 required
ccdb_postgres 1 xx.xx.xx.xx 1GB 1 8 required
uaadb 1 xx.xx.xx.xx 1GB 1 8 required
vcap_redis 1 xx.xx.xx.xx 1GB 1 8 required
uaa 1 xx.xx.xx.xx 1GB 1 8 required
acmdb 1 xx.xx.xx.xx 1GB 1 8 required
acm 1 xx.xx.xx.xx 1GB 1 8 required
cloud_controller 1 xx.xx.xx.xx 2GB 2 16 required
stager 1 xx.xx.xx.xx 1GB 1 8 required
router 2 xx.xx.xx.xx 512MB 1 8 required
health_manager 1 xx.xx.xx.xx 1GB 1 8 required
dea 2 xx.xx.xx.xx 2GB 2 16 required
mysql_node(*) 1 xx.xx.xx.xx 1GB 1 8 optional
mysql_gateway 1 xx.xx.xx.xx 1GB 1 8 optional
mongodb_node 1 xx.xx.xx.xx 1GB 1 8 optional
mongodb_gateway 1 xx.xx.xx.xx 1GB 1 8 optional
redis_node 1 xx.xx.xx.xx 1GB 1 8 optional
redis_gateway 1 xx.xx.xx.xx 1GB 1 8 optional
rabbit_node 1 xx.xx.xx.xx 1GB 1 8 optional
rabbit_gateway 1 xx.xx.xx.xx 1GB 1 8 optional
postgresql_node 1 xx.xx.xx.xx 1GB 1 8 optional
postgresql_gateway 1 xx.xx.xx.xx 1GB 1 8 optional
vblob_node 1 xx.xx.xx.xx 1GB 1 8 optional
vblob_gateway 1 xx.xx.xx.xx 1GB 1 8 optional
backup_manager 1 xx.xx.xx.xx 1GB 1 8 optional
service_utilities 1 xx.xx.xx.xx 1GB 1 8 optional
serialization_data_server 1 xx.xx.xx.xx 1GB 1 8 optional
services_nfs 1 xx.xx.xx.xx 1GB 1 8 optional
syslog_aggregator 1 xx.xx.xx.xx 1GB 1 8 optional
services_redis 1 xx.xx.xx.xx 1GB 1 8 optional
opentsdb 1 xx.xx.xx.xx 1GB 1 8 optional
collector 1 xx.xx.xx.xx 1GB 1 8 optional
dashboard 1 xx.xx.xx.xx 1GB 1 8 optional
Total: 36 39GB 40 320

From the above table, we can come up with required resource pools:

Pool Name Size Configuration Jobs
small 30 RAM:1GB, CPU: 1, DISK: 8GB nats, ccdb_postgres, uaadb,
vcap_redis, uaa, acmdb, acm, stager, health_manager, mysql_node, mysql_gateway, mongodb_node, mongodb_gateway, redis_node, redis_gateway, postgresql_node, postgresql_gateway, vblob_node
vblob_gateway, backup_manager ,service_utilities, collector, dashboard, serialization_data_server
services_nfs, syslog_aggregator, services_redis, opentsdb
medium 4 RAM:2GB, CPU: 2, DISK: 16GB debian_nfs_server
cloud_controller , dea
router 2 RAM:512M, CPU: 1, DISK: 8GB router

From the above two tables, we can start to modify the manifest file. We name the manifest file as cf.yml. The following sections explain the fields in details.

name
This is the cloud foundry deployment name. We can name it arbitrarily.

director_uuid
The director uuid is the uuid of bosh director we just deployed in Part III. We can retrieve this value by command:

$ bosh status

release
The release name should be the same as the name you entered when creating the cf-release. The version was generated automatically when the release was created.

compilation, update, networks, resource_pools
These fields are similar to those in bosh.yml file. Refer to the previous part for more information.

jobs
Jobs are the components of cloud foundry. Each job runs on a virtual machine. Jobs are described as below.

debian_nfs_server, services_nfs: these two jobs are used as nfs server in Cloud Foundry. As they serve as file servers, we should make sure that the “persistent_disk” property indeed exists.

syslog_aggregator: this job is uses to collect system logs and store them in the database.

nats: NATS is the message bus of Cloud Foundry. It’s a core component in Cloud Foundry.

opentsdb: this is a database that stores the log information. Since it is a database, it also requires a “persistent_disk” property.

collector: this job collects system information and stores them in databases.

dashboard: this is a web based tool for monitoring and reporting of Cloud Foundry Platform.

cloud_controller, ccdb: cloud_controller controls all the Cloud Foundry components. “ccdb” is the database for cloud controller. “persistent_disk” property is required in ccdb.

uaa, uaadb: uaa is used for user authentication and authorization. uaadb is the database that stores the user information. “persistent_disk” property is required for uaadb.

vcap_redis, services_redis: these two jobs are used to store the internal key-value pairs for Cloud Foundry.

acm, acmdb: acm is short for Access Control Manager. The ACM is a service that allows cloud foundry components to implement access control features. “acmdb” is the database for acm. “acmdb” also requires a “persistent_disk” property.

stager: stager is a job that packs the source code and all the required packages of user’s application. When staging is completed, the app is passed to dea for execution.

router: router is used to route user’s request to proper destination in Cloud Foundry.

health_manager, health_manager_next: health_manager is the job that monitors the health status of all users’ apps. health_manager_next is the next-generation version of health_manager. They will be co-existing for some time.

dea: “dea” is short for droplet execution agent. All users’ apps are executed in dea.

mysql_node, mysql_gateway, mongodb_node, mongodb_gateway, redis_node, redis_gateway, rabbit_node, rabbit_gateway, postgresql_node, postgresql_gateway, vblob_node, vblob_gateway: these jobs are all services that Cloud Foundry supplies. Each service has a node that provisions resources. The corresponding gateway lies between the cloud_controller and a service node and it acts as the gateway for each service.

backup_manager: used to backup users’ data and databases.

service_utilities:  Utilities of service management.

serialization_data_server: a server used to serialize data in Cloud Foundry.

properties:

This is another important part in cf.yml file. We should pay attention that the IP addresses in this section should be in sync with those in the jobs field.  You should replace the password and tokens with your private secure password and tokens.

domain:  this is the domain name for user’s access. We should also create a DNS server to resolve the domain to the load balancer’s IP address. In our example, we set the domain name as cf.local, so users can use vmc target api.cf.local when pushing apps.

cc.srv_api_uri: This property usually takes the format of http://api.<yourdomain>. For example, we set domain as cf.local, the srv_api_uri would be http://api.cf.local.

cc.password: this password must have at least 16 characters.

cc. allow_registration: if it is true, users can register an account by using vmc command. Set this to false to disable this behavior.

cc.admins: a list of admin users. Admin users can register through vmc command even the flag allow_registration is set to false.

Most of the ‘nfs_server’ in the properties should be set to the IP address of the job ‘services_nfs’.

mysql_node.production: If it is true, the memory of mysql_node must be at least 4GB. In an experimental environment, we can set it to false so that the memory of mysql_node can be set to less than 4GB.

Because the yml file may evolve as the new release of Cloud Foundry, there is an option of bosh command to validate the yml file. Type “bosh help”, you can see the usage and explanation of “bosh diff”:

$ bosh diff [<template_file>]

This command compares your current deployment manifest against the specified deployment manifest template. It helps you to keep your deployment configuration file up to date. A dev template can be found in deployments repos.

For example, you can run the following command to compare your yml file to the template file. Firstly, you must cd into the directory where your cf.yml file and the template file reside, and then use this command:

$ bosh diff dev-template.erb

This command will help you find any mistakes in the cf.yml file. If there are some fields missing, the command helps fill in it automatically. If there is a spelling mistake or other errors, the command reports a syntax error.

You can download a sample yml file from here:
https://github.com/vmware-china-se/bosh_doc/blob/master/cf.yml

When the manifest file is completed, we can now start to install Cloud Foundry.
1) In Part III, we have cloned CF repository from Gerrit by:

$ gerrit clone ssh://<your username>@reviews.cloudfoundry.org:29418/cf-release.git

2) Go to the directory and create a CF release.

$ cd cf-release
$ bosh create release

This will download all the packages, blob data and other resources needed. It will take several minutes depending on your network speed.

NOTE:
1. If you have edited code in cf-release, you may have to add –force option to bosh create release.
2. It is important to have direct internet connection when running this command.
3. If your network is slow or you do not have a direct connection to the internet, you may want to do this in a better environment. You can create the release on a machine with a good internet connection the option –with-tarball. Then you copy the generated tarball back to the system you want.

If nothing goes wrong, you can see a summary of this release like this:

Generating manifest...
----------------------
Writing manifest...
Release summary
---------------
Packages
+---------------------------+---------+-------+------------------------------------------+
| Name                      | Version | Notes | Fingerprint                              |
+---------------------------+---------+-------+------------------------------------------+
| sqlite                    | 3       |       | e3e9b61f8cdc2610480c2aa841e89dc0bb1dc9c9 |
| ruby                      | 6       |       | b35a5da6c214d9a97fdd664931bf64987053ad4c |
… …
| debian_nfs_server         | 3       |       | c1dc860ed6ab2bee68172be996f64f9587e9ac0d |
+---------------------------+---------+-------+------------------------------------------+
Jobs
+---------------------------+----------+-------------+------------------------------------------+
| Name                      | Version  | Notes       | Fingerprint                              |
+---------------------------+----------+-------------+------------------------------------------+
| redis_node                | 19       |             | 61098860eaa8cfb5dc438255ebe28db74a1feabc |
| rabbit_gateway            | 13       |             | ddcc0901ded1e45fdc4f318ed4ba8d8ccca51f7f |
… …
| debian_nfs_server         | 7        |             | 234fabc1a2c5dfbfd7c932882d947fed331b8295 |
| memcached_gateway         | 4        |             | 998623d86733a633c789849721e00d85cc3ebc20 |

Jobs affected by changes in this release
+------------------+----------+
| Name             | Version  |
+------------------+----------+
… …
| cloud_controller | 45.1-dev |
+------------------+----------+

Release version: 95.10-dev
Release manifest: /home/boshcli/cf-release/dev_releases/cf-def-95.10-dev.yml

As you can see, the dev-releases directory contains the release manifest yml file (and a tarball file, if –with-tarball option is on).

3) Target BOSH CLI to the director of BOSH. If you don’t remember the director’s IP, you can find it in your BOSH deployment manifest in part III.

$ bosh target 10.40.97.117:25555
Target set to `bosh_director (http://10.40.97.117:25555) Ver: 0.5.1 (release:abb3e7a4 bosh:2c69ee8c)

4) Upload cf- release by referring to the generated manifest file, e.g. cf-def-95.10-dev.yml in our example.

$ bosh upload release cf-def-95.10-dev.yml

This step will copy packages and jobs, and build them into a tarball, then verify this release to make sure files and dependencies are right. After verifying, it will upload release and create new jobs. Finally, you can see information telling you release uploaded:

Task 317 done
Started               2012-10-28 05:35:43 UTC
Finished              2012-10-28 05:36:44 UTC
Duration              00:01:01
Release uploaded

You can verify your release by:

$ bosh releases

You can see all the newly uploaded releases in the listing:

+--------+------------------------------------------------------+
| Name   | Versions                                             |
+--------+------------------------------------------------------+
| cf-def | 95.1-dev, 95.8-dev, 95.9-dev, 95.10-dev              |
| cflab  | 92.1-dev                                             |
+--------+------------------------------------------------------+

5) Now that, we have uploaded release and stemcell (the same stemcell as in part III), and manifest is ready, set deployment to the manifest:

$ bosh deployment cf-dev.yml
Deployment set to `/home/boshcli/cf-dev.yml'

We can deploy Cloud Foundry now:

$ bosh deploy

This will create VMs for the jobs, compile the packages and install dependencies. It will take several minutes depending on the server’s hardware condition. You can see output like:

Preparing deployment
binding deployment (00:00:00)
binding releases (00:00:01)
… …
Preparing package compilation
… …
Compiling packages
… …
Preparing DNS
binding DNS (00:00:00)
Creating bound missing VMs
… …
Binding instance VMs
… …
Preparing configuration
binding configuration (00:00:03)
… …
Creating job cloud_controller
cloud_controller/0 (canary) (00:02:45)
… …
Done                    1/1 00:08:41

Task 318 done

Started               2012-10-28 05:37:52 UTC
Finished              2012-10-28 05:49:43 UTC
Duration              00:11:51
Deployed `cf-dev.yml' to `bosh_director'

To check your deployment, you can use this command:

$ bosh deployments
+----------+
| Name     |
+----------+
| cf.local |
+----------+
Deployments total: 1

You can also verify every the running status of VMs:

$ bosh vms
+---------------------------+---------+---------------+-------------+
| Job/index                 | State   | Resource Pool | IPs         |
+---------------------------+---------+---------------+-------------+
| acm/0                     | running | small         | 10.40.97.58 |
| acmdb/0                   | running | small         | 10.40.97.57 |
| cloud_controller/0        | running | medium        | 10.40.97.59 |
… …
+---------------------------+---------+---------------+-------------+
VMs total: 40

At this moment, Cloud Foundry has been completely installed. If you cannot wait to verify the installation, you can use vmc command to target one of the routers’ IP address and deploy a test web app on it (see subsequent section). Because there is no DNS available, you need to have at least these two lines in the hosts file of a vmc client machine and the machine running a browser to test the web app:

<router’s IP address>  api.yourdomain.com
<router’s IP address>  <youtestapp>.yourdomain.com

If the above testing works fine, your Cloud Foundry instance is working. The last thing is to take care of the load balancer and DNS. These two components are not part of Cloud Foundry’s components. However, they need to be set up properly in a production environment. So we briefly talk about how to set them up.

You can deploy either a hardware or software load balancer (LB) to distribute the load evenly to multiple instances of router components. In our sample deployment we have two routers. For a software LB, you can use Stingray Traffic Manager.  It can be downloaded from here: https://support.riverbed.com/download.htm?filename=public/software/stingray/trafficmanager/9.0/ZeusTM_90_Linux-x86_64.tgz

A DNS server is needed to resolve the domain of your Cloud Foundry instance. Basically, the DNS server resolves a wildcard name like *.yourdomain.com to the IP address of the load balancer. If you do not have a LB, you can set up DNS rotation to resolve the domain to routers in a round robin fashion.

When the LB and DNS is setup properly, you can start to deploy apps on your instance.

Cloud Foundry has a command-line tool known as VMC. It can perform most of the operations on Cloud Foundry, such as configuring your applications, deploying them to Cloud Foundry and monitor the status of your apps. To install VMC, you must install Ruby and RubyGems (a Ruby package manager) on the computer on which you want to run VMC. Currently Ruby 1.8.7 and 1.9.2 are supported.  After that, you can install VMC by the below command ( more on vmc installation http://docs.cloudfoundry.com/tools/vmc/installing-vmc.html):

$ sudo gem install vmc

Now, specify the target to your Cloud Foundry instance, the URL should look like api.yourdomain.com, for example:

$ vmc target api.cf.local

Log in with the admin user’s credential, which is specified in the deployment manifest:

$ vmc login

Initially, you will be asked to set password for your account. After logging in, you get the information of your Cloud Foundry instance:

$ vmc info

Now, let’s create and deploy a simple hello world Sinatra application to verify the instance.

$ mkdir ~/hello
$ cd ~/hello

Create a Ruby file called hello.rb with following contents:

require 'sinatra'

get '/' do
"Hello from Cloud Foundry"
end

Save this file and we are about to upload this application:

$ vmc push

Complete the prompts like below

Would you like to deploy from the current directory? [Yn]:
Application Name: hello
Detected a Sinatra Application, is this correct? [Yn]:
Application Deployed URL [hello.cf.local]:
Memory reservation (128M, 256M, 512M, 1G, 2G) [128M]:
How many instances? [1]:
Bind existing services to 'hello'? [yN]:
Create services to bind to 'hello'? [yN]:
Would you like to save this configuration? [yN]:

After a while, you will see the output:

Creating Application: OK
Uploading Application:
Checking for available resources: OK
Packing application: OK
Uploading (0K): OK
Push Status: OK
Staging Application 'hello': OK
Starting Application 'hello': OK

Now, go visit the application’s URL: hello.cf.local in your browser. If you can see the text, your application has been successfully deployed.

Congratulations, your Cloud Foundry instance had been completely set up. It is functionally identical to the cloudfoundry.com.

More on deploying Cloud Foundry on vSphere using BOSH:

Building Cloud Foundry on vSphere using BOSH Part 3

Installing micro BOSH and BOSH

When installing BOSH CLI is completed, we now start the installation of a micro BOSH. As mentioned before, Micro BOSH can be considered as a miniature of BOSH. While a standard BOSH has its components spread across 6 VMs, a micro BOSH in contrast contains all components in a single VM. It can be easily set up and is usually used to deployed small releases, such as BOSH. In this sense, BOSH is deployed by itself. As put it by the BOSH team, it is referred as “Inception”.

The below steps are based on the official BOSH document by adding more implementation details.

1) In the BOSH CLI VM, install the BOSH Deployer ruby gem.

$ gem install bosh_deployer

Once you have installed the deployer, you will see some extra commands appear after typing bosh on your command line.

$ bosh help
  ...
Micro
micro deployment [<name>]      Choose micro deployment to work with
micro status                   Display micro BOSH deployment status
micro deployments              Show the list of deployments
micro deploy <stemcell>        Deploy a micro BOSH instance to the currently selected deployment
--update                       update existing instance
micro delete                   Delete micro BOSH instance (including persistent disk)
micro agent <args>             Send agent messages
micro apply <spec>             Apply spec

NOTE: The bosh micro commands must be run within a micro BOSH deployment directory

2) In vCenter, under the view Home->Inventory->VMs and Templates, make sure the folders for virtual machines and templates are already created (see part II). These folders are used in the deployment configuration.

3) From the view Home->Inventory->Datastores, choose the NFSdatastore datastore we created and browse it.

Right click on the root folder and create a sub folder for storing virtual machines. In this example, we name it “boshdeployer”. This folder name will be the value of the “disk_path” parameter in our deployment manifest.
NOTE: If you do not have a shared NFS storage, you may use the local disks of the hypervisors as datastore. (However, please be aware that local disks are only recommended for an experimental system.) You can name the datastores as “localstore1” for host 1, “localstore2” for host 2, and so on. Later in the manifest file, you can use a wildcard pattern like “localstore*” to specify the datastore of all hosts. The “boshdeployer” folder should be created on all local datastores.

4) Download public stemcell

$ mkdir -p ~/stemcells
$ cd stemcells
$ bosh public stemcells

The output looks like this:

+---------------------------------+-------------------------------------------------------+
| Name                            | Url                                                   |
+---------------------------------+-------------------------------------------------------+
| bosh-stemcell-0.5.2.tgz         | https://blob.cfblob.com/rest/objects/4e4e78bca31e1... |
| bosh-stemcell-aws-0.5.1.tgz     | https://blob.cfblob.com/rest/objects/4e4e78bca21e1... |
| bosh-stemcell-vsphere-0.6.4.tgz | https://blob.cfblob.com/rest/objects/4e4e78bca31e1... |
| micro-bosh-stemcell-0.1.0.tgz   | https://blob.cfblob.com/rest/objects/4e4e78bca51e1... |
+---------------------------------+-------------------------------------------------------+
To download use 'bosh download public stemcell <stemcell_name>'.For full url use --full.

Download the stemcell of micro BOSH using below command:

$ bosh download public stemcell micro-bosh-stemcell-0.1.0.tgz

NOTE: The stemcell is 400-500MB in size. It may take a long time to download in a slow network. In this case, you can download using any tool (e.g. Firefox browser) which can resume a transmission from failures. Use the –full argument to display the full URL for download.

5) Configure your deployment (.yml) file, and save it under a folder with the same name defined in your .yml file. In our example, it is “micro01”.

$ cd ~
$ mkdir deployments
$ cd deployments
$ mkdir micro01

In the yml file, there is a section about vCenter. Enter the name of folders we created in Part II. The “disk_path” should be the folder we just created in the datastore (NFSdatastore).  The value of datastore_pattern and persistent_datastore_pattern is the shared data store name (NFSdatastore). If you use local disks, this could be the wildcard string like “localstore*”.

datacenters:
- name: vDataCenter
vm_folder: vm_folder
template_folder: template
disk_path: boshdeployer
datastore_pattern: NFSdatastore
persistent_datastore_pattern: NFSdatastore
allow_mixed_datastores: true

Here is a link of a sample yml file of micro BOSH:
https://github.com/vmware-china-se/bosh_doc/blob/master/micro.yml

6) Set the micro BOSH Deployment using:

$ cd deployments
$ bosh micro deployment micro01

Deployment set to '~/deployments/micro01/micro_bosh.yml'

$ bosh micro deploy ~/stemcells/micro-bosh-stemcell-0.1.0.tgz

If everything goes well, micro BOSH will be deployed within a few minutes. You can check the deployment status by this command:

$ bosh micro deployments

You will see your micro BOSH deployment listed:

+---------+-----------------------------------------+-----------------------------------------+
| Name    | VM name                                 | Stemcell name                           |
+---------+-----------------------------------------+-----------------------------------------+
| micro01 | vm-a51a9ba4-8e8f-4b69-ace2-8f2d190cb5c3 | sc-689a8c4e-63a6-421b-ba1a-400287d8d805 |
+---------+-----------------------------------------+-----------------------------------------+

Installing BOSH

When the micro BOSH is ready, we can now use it to deploy BOSH, which is a distributed system with 6 VMs. As mentioned in previous section, we need to have three items: a stemcell as the VM template, a BOSH release as the software to be deployed, and a deployment manifest file for deployment-specific definition. Let’s work on them one by one.

1) First, we target our BOSH CLI to the director of the micro BOSH. The BOSH director can be thought of as the controller or orchestrator of BOSH. All BOSH CLI commands are sent to the director for execution. The IP address of the director is defined in the yml file we used to create micro BOSH. The default credential of BOSH director is admin/admin. In our example, we use the below commands for targeting micro BOSH and authentication:

$ bosh target 10.40.97.124:25555
$ bosh login

2) Next, we download the bosh stemcell and upload to micro BOSH. This step is similar to downloading a stemcell of micro BOSH. The only difference is that we choose the stemcell for BOSH instead of micro BOSH.

$ cd ~/stemcells
$ bosh public stemcells

A list of stemcells is displayed; choose the latest stemcell to download:

$ bosh download public stemcell bosh-stemcell-vsphere-0.6.4.tgz
$ bosh upload stemcell bosh-stemcell-vsphere-0.6.4.tgz

If you have created a Gerrit account in Part II, skip step 3-7.

3) Sign up for the Cloud Foundry Gerrit server at http://reviews.cloudfoundry.org
4) Set up your ssh public key (accept all defaults)

$ ssh-keygen -t rsa

Copy your key from ~/.ssh/id_rsa.pub into your Gerrit account
5) Create and upload your public SSH key in your Gerrit account profile
6) Set your name and email

$ git config --global user.name "Firstname Lastname"
$ git config --global user.email your_email@youremail.com

7) Install out gerrit-cli gem
8) Clone the release code from Cloud Foundry repositories using Gerrit. The below commands get the code of BOSH and Cloud Foundry, respectively.

$ gerrit clone ssh://<yourusername>@reviews.cloudfoundry.org:29418/bosh.git
$ gerrit clone ssh://<yourusername>@reviews.cloudfoundry.org:29418/cf-release.git

We then create our own BOSH release:

$ cd bosh-release
$ ./update
$ bosh create release  --with-tarball

If there are local code conflicts, you can add “–force” option:

$ bosh create release  --with-tarball --force

This step may take some time to complete depending on the speed of your network. It first downloads binaries from a blob server. It then builds the packages and generates manifest files. The command’s output looks like below:

Syncing blobs…
...
Building DEV release
Please enter development release name: bosh-dev1
---------------------------------
Building packages
…
Generating manifest...
…
Copying jobs...

At last, when the release is created, you will see something like below. Notice the last two lines indicate the manifest file and the release file.

Generated /home/boshcli/bosh-release/dev_releases/bosh-dev1-6.1-dev.tgz

Release summary
---------------
Packages
+----------------+---------+-------+------------------------------------------+
| Name           | Version | Notes | Fingerprint                              |
+----------------+---------+-------+------------------------------------------+
| nginx          | 1       |       | 1f01e008099b9baa06d9a4ad1fcccc55840cf56e |
……
| ruby           | 1       |       | c79b76fcb9bdda122ad2c52c3604ba950b482681 |
+----------------+---------+-------+------------------------------------------+

Jobs
+----------------+---------+-------------+------------------------------------------+
| Name           | Version | Notes       | Fingerprint                              |
+----------------+---------+-------------+------------------------------------------+
| micro_aws      | 1.1-dev | new version | fadbedb276f918beba514c69c9e77978eadb65ac |
……
| redis          | 2       |             | 3d5767e5deec579dee61f2c131982a97975d405e |
+----------------+---------+-------------+------------------------------------------+

Release version: 6.1-dev
Release manifest: /home/boshcli/bosh-release/dev_releases/bosh-dev1-6.1-dev.yml
Release tarball (88.8M): /home/boshcli/bosh-release/dev_releases/bosh-dev1-6.1-dev.tgz

9) Upload the created release to micro BOSH’s director.

$ bosh upload release dev_releases/bosh-dev1-6.1-dev.tgz

10) Configure BOSH deployment manifest. First, we get the director’s UUID information by doing:

$ bosh status
Updating director data... done
Target         micro01 (http://10.40.97.124:25555) Ver: 0.4 (00000000)
UUID           7d72eb71-9a98-4081-9857-ad7c7ff4ee33
User           admin
Deployment     /home/boshcli/bosh-dev1.yml

Now we are moving to the trickiest part of this installation: modifying the deployment manifest file. Since most BOSH deployment errors are caused by improper settings in the manifest file, we explain this in more details.

To get started, let’s get the manifest template from here: https://github.com/cloudfoundry/oss-docs/blob/master/bosh/tutorial/examples/bosh_manifest.yml

Since the official BOSH document provides the specification of the manifest file, we assume you have gone through it before reading this article. We won’t go into every detail of this file; instead, we discuss some important items in the manifest file.

Network

Below is an example of the network section.

networks:            #define networks- name: default
subnets:
- reserved:        #ips you don’t want to allocate
- 10.40.97.121 - 10.40.97.254
static:          #ips you will use
- 10.40.97.115 - 10.40.97.120
range: 10.40.97.0/24
gateway: 10.40.97.1
dns:
- 10.40.62.11
- 10.135.12.101
cloud_properties: #the same network as all other vms.
name: VM Network

static: contains the IP addresses of BOSH VMs.
reserved: IP addresses BOSH should not use. It is very important to exclude any IP addresses which have been assigned to other devices on the same network, for example, storage devices, network devices, micro BOSH and vCenter host. During the installation, micro BOSH may spin up some temporal VMs (worker VMs) for compilation. If we do not specify the reserved addresses, these temporal VMs may have conflicts of IP address with existing devices or hosts.
cloud_properties: name is the network name we defined in vSphere (see part II).

Resource Pool

This section defines the configuration (cpu, memory, disk and network) of VMs used by jobs. Usually, jobs of an application vary in resource consumption. For example, some jobs require more memory than others, while some jobs need more vCPUs for computing-intensive tasks. Based on the actual requirements, we should create one or more resource pools. One thing to note is that the size of all pools should be equal to the total number of job instances defined in the manifest file. When deploying BOSH, since there are 6 VMs (6 jobs) altogether, the size of all pools should add up to 6.

In our manifest file, we have 3 resource pools:

Pool Name Size Configuration Jobs
small 3 RAM:512MB, CPU:1, DISK:2GB nats,  redis, health_monitor
medium 2 RAM:1GB, CPU: 1, DISK: 8GB postgres, blobstore
director 1 RAM:2GB, CPU: 2, DISK: 8GB director

Compilation

This section defines the worker VMs created for package compiling. In a system with limited resource, we should reduce the number of concurrent worker VMs to ensure a successful compilation. In our example, we define 4 worker VMs.

Update

This section contains a very useful parameter: max_in_flight. It tells BOSH the maximum jobs can be installed in parallel. In a slow system, try to reduce this number. If you set this number to 1, it means jobs are deployed sequentially. For BOSH deployment, we recommend setting this number to 1 to ensure BOSH can be installed successfully.

Jobs

There are six jobs in the BOSH release. Each job occupies a VM. Depending on the nature of a job and the resource consumption, we allocate jobs to various resource pools. One thing to note is that we need to assign persistent disks to three jobs: postgres, director and blobstore. Without persistent disks, these jobs will not work properly as their local disks get full very soon.

It is a good idea to fill in a spreadsheet like below to plan your deployment. Based on the spreadsheet, you can modify the deployment manifest.

Job Resource_pool IP
nats small 10.40.97.120
postgres medium 10.40.97.119
redis small 10.40.97.118
director director 10.40.97.117
blob_store medium 10.40.97.116
health_monitor small 10.40.97.115

Based on the above table, we created a sample deployment manifest, you can download it from here:

https://github.com/vmware-china-se/bosh_doc/blob/master/bosh.yml

11) After updating the deployment manifest file, we can start the actual deployment by below commands:

$ bosh deployment bosh_dev1.yml
$ bosh deploy

This may take some time to finish depending on your network condition and available hardware resources. You can also check out the vCenter console to see VMs being created, configured and destroyed.

Preparing deployment
…..
Compiling packages
……
Binding instance VMs
postgres/0 (00:00:01)
director/0 (00:00:01)
redis/0 (00:00:01)
blobstore/0 (00:00:01)
nats/0 (00:00:01)
health_monitor/0 (00:00:01)
Done                    6/6 00:00:01

Updating job nats
nats/0 (canary) (00:01:14)
Done                    1/1 00:01:14
……
Updating job director

director/0 (canary) (00:01:10)
Done                    1/1 00:01:10
……

If everything goes well, you will eventually see something like this:

Task 14 done
Started                         2012-08-12 03:32:24 UTC
Finished       2012-08-12 03:52:24 UTC
Duration      00:20:00
Deployed `bosh-dev1.yml' to `micro01'

This means you have successfully deployed BOSH. You can see your deployment by doing:

$ bosh deployments
+-------+
| Name  |
+-------+
| bosh1 |
+-------+

You can check all virtual machine’s status by doing:

$ bosh vms

If nothing goes wrong, you will see status of VMs like:

+------------------+---------+---------------+--------------+
| Job/index        | State   | Resource Pool | IPs          |
+------------------+---------+---------------+--------------+
| blobstore/0      | running | medium        | 10.40.97.116 |
| director/0       | running | director      | 10.40.97.117 |
| health_monitor/0 | running | small         | 10.40.97.115 |
| nats/0           | running | small         | 10.40.97.120 |
| postgres/0       | running | medium        | 10.40.97.119 |
| redis/0          | running | small         | 10.40.97.118 |
+------------------+---------+---------------+--------------+
VMs total: 6

Building Cloud Foundry by BOSH:

Building Cloud Foundry on vSphere using BOSH Part 2

Install BOSH CLI

Important Prerequisites:

Throughout the installation process of BOSH and Cloud Foundry, direct internet connection is required. This is very important because some of the software bits are downloaded directly from internet sources, such as Ruby gems and some open source software. Setting up a web proxy server between your VMs and the internet won’t work.

The other prerequisite is a stable internet connection. If your network is slow or unreliable when downloading files from internet, your installation may fail with timeout or connection error.

We have seen many unsuccessful setups due to internet connection issues. It is highly recommended you check with your network administrator before starting the BOSH installation.

Create a Cluster in vCenter

Assume all nodes are virtual machines, we first install vSphere (we use V5.x in this article) on all bare metal servers. The vSphere servers are connected by the Management Network VLAN. Once it is done, we create a VM on one of the hypervisors to install Windows 2008 R2 64 bit. We then install vCenter on this Windows 2008 VM. The next step is to connect to vCenter using vSphere client so that we can manage the servers.

We can install a vSphere client on any Windows machine (even a virtual machine). After that, we can connect to vCenter by the vSphere client remotely. Firstly, let’s create a datacenter in vCenter. Right click on the vCenter node in the left pane and choose “New Datacenter” to add a new data center.Create a Data Center in vCenter

Next is to right click the newly created data center node and select “New Cluster…”.

During the “New Cluster Wizard”,  if you turned on vSphere DRS feature, you will be asked to configure VMware DRS. Make sure the “automation level” is set to “partially automated” or “Fully automated” as shown below. If you choose “Manual”, you will be as prompted by a popup to enter your choice. This behavior may block your BOSH automated installation.

Then, select the “Enable Host Monitoring” checkbox and select “Disable: Power on VMs that violate availability constraints”:

Then, go to the sub-part of “VM Monitoring”, choose “Disabled”:

Click Next, choose as follows:

Adding vSphere Hosts

The next step is to place hypervisors into the cluster we just created. Right click on the cluster node and choose “Add Host…”. For each vSphere server, enter its IP address, administrator’s username and password and confirm your configuration:

After adding all hosts, they will be listed in the Datacenter->Hosts tab:

Attach Datastore to Hosts

All hosts in the cluster should share the same NFS storage. For each host, we add in the storage as datastore. In vCenter, click on the vSphere host and choose the “Configuration” tab. Select the “Hardware”->”Storage”. Click the upper right “Add Storage…Create a Data Center in vCenter

In the “Select Storage Type” dialogue, choose “Network File System” .

Enter the ip address of your NFS storage, the folder name, and the datastore name. It is very important to use exactly the same datastore name for all hosts in the cluster. In this example, we use the name “NFSdatastore”.

Create Folders for VMs and Templates

From vCenter’s navigation bar, choose the view Home->Inventory->VMs and Templates, create folders as below:

These folders are used later for grouping BOSH and Cloud Foundry VMs.  In the above example, “template_folder_bosh” is used to place BOSH stemcells. “vm_folder_bosh” is used for BOSH nodes. “template_folder” keeps Cloud Foundry stemcells. “vm_folder” stores Cloud Foundry nodes. These names will be used in the deployment manifest file later.

Network Configuration

The VMs of Cloud Foundry will be deployed onto one or multiple networks. Before a deployment, we need to create networks in vSphere. The below diagram illustrates the network connections required by Cloud Foundry.

On each vSphere host, we create two networks:

1)      CF Network: mapped to CF VLAN

2)      Service Network: mapped to Service VLAN.

Most of the VMs reside on the CF Network. Only the Router VMs are dual-homed with the Service Network and CF network.

NOTE: In an experimental environment, you can put all VMs on the same network to simplify the installation process. Hence a single network on a hypervisor may suffice.

To create a network, choose the “Hosts and Clusters” view. Select a host and switch to the “configuration” tab. Then select “Networking” and click “Add Networking”:

The connection type should be “Virtual Machine”:

Use an existing vSwitch:

In next step, rename the network label to “CF Network”. If your network administrator has assigned a VLAN ID, enter the CF VLAN ID accordingly.

Then Click “finish” and complete the network creation. Repeat the steps to create “Service Network”, just name the network label as “Service Network”.

It is important to keep the network name exactly the same on all hosts in the same cluster. The below figure shows two networks had been created for a host. We name them as “CF Network” and “Service Network”. These names will be used in the bosh and cloud foundry yml files later.

Also, if you check from the Datacenter->Inventory->Networking view, it shows the following:

Create a VM for BOSH CLI

In vCenter, we select one of the hosts in the cluster to create a VM. Click “Create a new virtual machine”. We will install on this VM a 64bit Ubuntu 10.04 OS. Assign the VM with 2 vCPUs, 2GB memory, 20GB disk space (or more). During the installing, make sure to set network manually.

We now start to install BOSH CLI on the VM. Log on to Ubuntu and follow the below steps. (Note, these steps are mostly from the official BOSH document. They are listed here for your convenience.)

1)      Install ruby via rbenv:
1. Bosh is written in Ruby. Let’s install Ruby’s dependencies:

$ sudo apt-get install git-core build-essential libsqlite3-dev curl \
libmysqlclient-dev libxml2-dev libxslt-dev libpq-dev genisoimage

2. Get the latest version of rbenv

$ git clone git://github.com/sstephenson/rbenv.git .rbenv

3. Add ~/.rbenv/bin to your $PATH for access to the rbenv command-line utility

$ echo 'export PATH="$HOME/.rbenv/bin:$PATH"' >> ~/.bash_profile

4. Add rbenv init to your shell to enable shims and autocompletion

$ echo 'eval "$(rbenv init -)"' >> ~/.bash_profile

5. Download Ruby 1.9.2
Note: You can also build ruby using ruby-build plugin for rbenv. See https://github.com/sstephenson/ruby-build

$ wget http://ftp.ruby-lang.org/pub/ruby/1.9/ruby-1.9.2-p290.tar.gz

6. Unpack and install Ruby

$ tar xvfz ruby-1.9.2-p290.tar.gz
$ cd ruby-1.9.2-p290
$ ./configure --prefix=$HOME/.rbenv/versions/1.9.2-p290
$ make
$ make install

7. Restart your shell so the path changes take effect

$ source ~/.bash_profile

8. Set your default Ruby to be version 1.9.2

$ rbenv global 1.9.2-p290

Note: The rake 0.8.7 gem may need to be reinstalled when using this method

$ gem pristine rake

9. Update rubygems and install bundler.
Note: After installing gems (gem install or bundle install) run rbenv rehash to add new shims

$ rbenv rehash
$ gem update –system
$ gem install bundler
$ rbenv rehash

2) Install BOSH CLI:
1. Sign up for the cloud foundry gerrit server at http://reviews.cloudfoundry.org
2. Set up your ssh public key (accept all default):

$ ssh-keygen –t rsa

3. Copy your key from ~/.ssh/id_rsa.pub into your Gerrit account.
4. Create and upload your public SSH key in your Gerrit account profile.
5. Set your name and email:

$ git config --global user.name "Firstname Lastname"
$ git config --global user.email your_email@youremail.com

6. Install out gerrit-cli gem:

$ gem install gerrit-cli

7. Run some rake tasks to install the BOSH CLI:

$ gem install bosh_cli
$ rbenv rehash
$ bosh –version

If everything works well, the last command will show the bosh version you just installed. This indicates that BOSH CLI has been successfully installed.

How to deploy Cloud Foundry using BOSH:

Building Cloud Foundry on vSphere using BOSH Part I

First, let’s discuss the hardware and software prerequisites of a Cloud Foundry installation.

Software:
1) 64-bit Ubuntu 10.04 LTS, better in ISO format.
2) vSphere V4.1 or V5.x,
3) vSphere client
4) vCenter (installed on a Windows 2008 R2 64bit or a Windows 2003 server, physical or virtual machine)

Hardware:
Provided all nodes are VMs, the below table shows the number of VMs required:

# of nodes OS can be physical machine
BOSH CLI 1 Ubuntu Y
vCenter+vSphere Client 1 Win2008 Y, can be split into two nodes
micro BOSH 1 Ubuntu N
BOSH 6 Ubuntu N
Cloud Foundry 34 Ubuntu N, see notes
Total: 43

It should be noted that the number of nodes of Cloud Foundry in the above table reflects the minimum number of nodes required. This number may vary depending on the actual scale of a Cloud Foundry deployment. There are generally two rules to be considered when choosing of the hardware configuration:

1) The total number of vCPUs should not be more than twice the total number of physical cores. In a production system, this ratio should better be below 2.
2) The total memory of all VMs should be less than the physical memory of all hypervisors.

Here is an example configuration of hardware provided each VM has 4 GB memory and 1 vCPU (assume vCPU : CPU ratio is 1):

6 x servers, each has 8 CPU cores and 32GB RAM.

For an experimental system, we saw a successful deployment on a single server with the below configuration (assume each VM has 256 MB memory):

1 x server, 8 CPU cores and 16GB RAM

Besides the servers, storage is another key factor in a cloud platform. The storage should better have 200GB or more usable space to keep the images of all VMs. It is recommended the use of fast shared storage in a production system. NFS is the most commonly used protocol to share the storage between the hypervisors. In an experimental environment, a Linux-based NFS server can be used in lieu of a dedicated storage. Though local disks on hypervisors may work in a POC type environment, it is generally not recommended for any production system.

The last thing we should plan for is the network. In a lab environment, we could simply place all nodes on the same network. However, in a production system, components of Cloud Foundry should be properly allocated to various VLANs for security and management purposes. In this article series, we are not going into the details of networking. For illustration purpose, we will have five VLANs during our deployment:

VLAN Nodes
Management VLAN Hypervisors and NFS storage
CF-internal VLAN BOSH VMs and VMs of Cloud Foundry
CF VLAN BOSH VMs, and VMs of cloud foundry
Service VLAN For LB, dual-home routers
Public VLAN For LB, incoming requests

The installation of a Cloud Foundry instance has the following four parts:

1) Install the BOSH CLI tool in an Ubuntu 10.04 OS. This could be either a physical or virtual machine.
2) Install the micro BOSH. The micro BOSH is a VM that contains all components of BOSH. It has the same functions of a standard BOSH. However, it has limited disk space to store multiple releases. The purpose of having a micro BOSH is to install the BOSH, which is a distributed system itself.
3) Install BOSH by micro BOSH. BOSH usually consists of 6 VMs with each component resides on a node. One of the nodes called blobstore has a big disk size which can hold larger releases.
4) Install the Cloud Foundry instance by BOSH.

More blogs on installing Cloud Foundry using BOSH:

Cloud Foundry BOSH Introduction

Cloud Foundry is the first open source PaaS in the industry. It supports multiple frameworks, multiple services and multiple cloud providers. BOSH was originally created in the context of the Cloud Foundry project. Nevertheless, it is a general tool chain for deployment and lifecycle management of large scale distributed services. In a few subsequent blogs, I will walk you through the process of installing the Cloud Foundry platform using BOSH.

Cloud Foundry contains a number of components. The most important ones are Cloud Controller, NATS, Router, Health Manager and DEA. An introduction of these components can be found here: http://blog.cloudfoundry.com/2011/04/19/cloud-foundry-open-paas-deep-dive/ . The components are designed in a way that makes the system horizontally scalable. This means a Cloud Foundry instance can have one or more copies of each component to meet the load needed by a cloud. The components can be distributively deployed on multiple nodes.

BOSH is the tool we use to deploy the components of Cloud Foundry onto distributed nodes. (In a virtualized environment, we use the term “node” interchangeably with “virtual machine” or VM). Before we move to the details of a real deployment, let’s introduce briefly how BOSH works when it deploys a system. We strongly suggest you read the official BOSH document here. (https://github.com/cloudfoundry/oss-docs/blob/master/bosh/documentation/documentation.md)

BOSH is a recursive acronym for Bosh Outter SHell. In contrast to the “Outter Shell”, the system being deployed and managed by BOSH is called the “Inner Shell”. The below diagram illustrates a simplified model of BOSH.

BOSH can be considered as a server or a robot which orchestrates the deployment process of a distributed system. There is a ruby tool which can interact with BOSH Command Line Interface (CLI). Before BOSH starts to deploy a system, it needs three prerequisites: a stemcell, a release (the software to be installed), and a deployment manifest. Let’s look at these three items in more detail.

 Stemcells:  In a cloud platform, VMs are usually cloned from a template. A stemcell is a VM template containing a standard Ubuntu distribution. A BOSH agent is also embedded in the template so that BOSH can take control of VMs cloned from the stemcell. The name “stemcell” originated from biological term “stem cells”, which refers to the undifferentiated cells that are able to grow into diverse cell types later. Similarly, VMs created by a BOSH stemcell are identical at the beginning. After inception, VMs are configured with different CPU/memory/storage/network, and installed with different software packages. Hence, VMs built from the same stemcell template behavior differently.

 Releases: A release contains collections of software bits and configurations which will be installed onto the target system. Each VM is deployed with a collection of software, which is called a job. Configurations are usually templates which contain parameters such as IP address, port number, user name, password, domain name. These parameters will be replaced at deploy time by the properties defined in a deployment manifest file.

 Deployments: A deployment is something that turns a static release into runnable software on VMs. A Deployment Manifest defines the actual values of parameters needed by a deployment. During a deployment process, BOSH substitutes the parameters in the release and makes the software run on the configuration as planned.

When the above 3 items are ready, they will be uploaded to BOSH by the BOSH CLI tool. After that, a BOSH installation of a distributed system typically has the following major steps:

1) If some packages in the release require compilation, BOSH first creates a few temporal VMs (worker VMs) to compile them. After compiling the packages, BOSH destroys the worker VMs and stores the binaries to its internal blobstore.

2) BOSH creates a pool of the VMs which will be the nodes where the release to be deployed on. These VMs are cloned from the stemcell with a BOSH agent installed.

3) For each job of the release, BOSH picks a VM from the pool and updates its configuration according to the Deployment Manifest. The configuration may include IP address, persistent disk size etc.

4) When the reconfiguration of the VM is completed, BOSH sends commands to the agent inside each VM. The commands tell the agent to install software packages. During the installation, the agent may download packages from BOSH and installs them. When the installation finishes, the agent runs the starting script to launch the job of the VM.

5) BOSH repeats step 3-4 until all jobs are deployed and launched. The jobs can be deployed simultaneously or sequentially. The value “max_in_flight” in the manifest file controls this behavior. When it is 1, it means the jobs are deployed one by one. This value is useful for a slow system to avoid timeout caused by resource congestion. While it is greater than one, it means jobs are deployed in parallel.

More on deploying Cloud Foundry on vSphere using BOSH: